
Двухнедельный обзор фондовых рынков №317. «Медвежий» капкан Трампа
Market Review as of October 6
Global Perspective
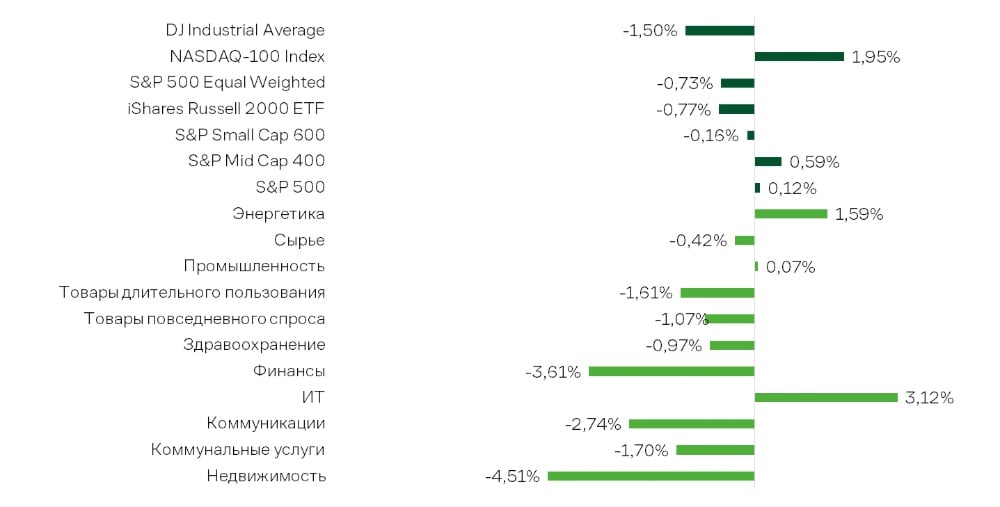
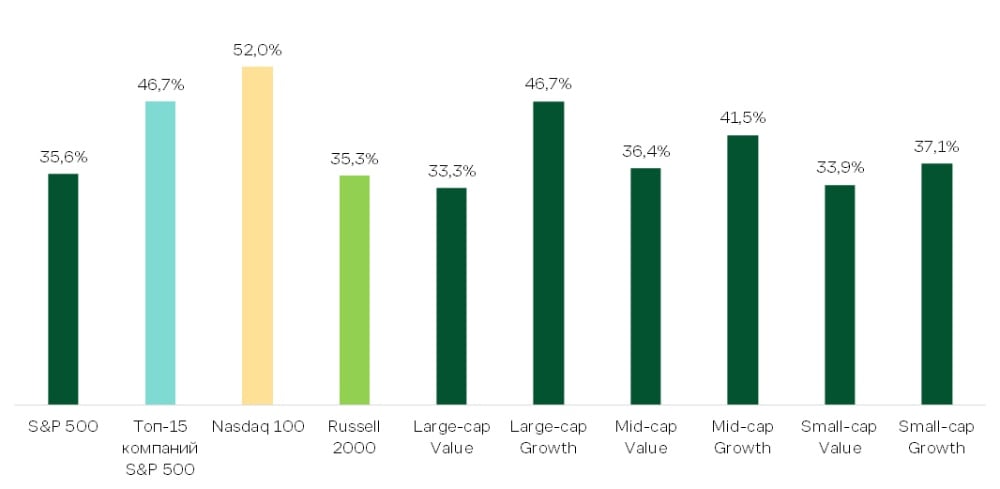
U.S. equities edged higher over the review period, but the gains were once again concentrated in a narrow group of stocks. The S&P 500 gained just 0.12%, and the Nasdaq-100 rose 1.95%, while the equal-weighted S&P 500 fell 0.73%, the Dow Jones declined 1.50%, and the Russell 2000 lost 0.77%. Only 35.6% of S&P 500 constituents posted positive returns. The main support for the indices came from Information Technology, while most other sectors ended the period lower.
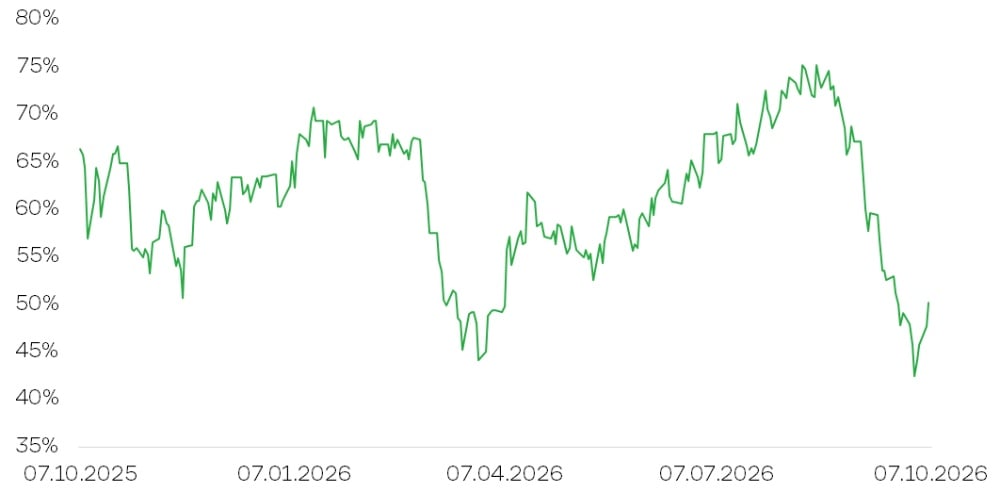
The market looks much weaker under the surface than the headline indices suggest. Only 50% of S&P 500 constituents are trading above their 200-day moving average, while just 29% are above their 50-day moving average, pointing to limited participation in both the longer- and shorter-term uptrend. The divergence is also clear in the distance from record highs: 51% of constituents are more than 20% below their all-time highs, while 35% are more than 30% below them. Importantly, these are all-time highs, not 52-week highs. In other words, resilience at the index level is not yet being matched by most of the stocks underneath it.
The clear winner over the period was Technology, up 3.12%. Sentiment was supported by the September 29 meeting between the U.S. administration and executives from the largest technology companies. The two sides agreed on voluntary AI safety standards, including independent audits and internal controls, while Donald Trump reiterated support for the rapid expansion of data centers. For the market, the takeaway was that tighter oversight does not yet mean a halt or slowdown in AI-infrastructure buildout, a risk company executives had previously flagged.
The positive momentum within Information Technology was uneven, however. Seagate, Western Digital, Micron, SanDisk and SK Hynix fell after reports that Toshiba plans to roughly double data-center hard-drive production capacity by fiscal 2027 from 2025 levels. The concern is that higher supply could eventually ease shortages and erode manufacturers’ pricing power. The read-through is most direct for hard-drive makers Seagate and Western Digital. For DRAM and NAND producers, the selloff reflects concerns spilling into adjacent segments rather than any confirmed increase in their own product supply. Despite the share-price weakness, earnings estimates for these companies have not changed so far.
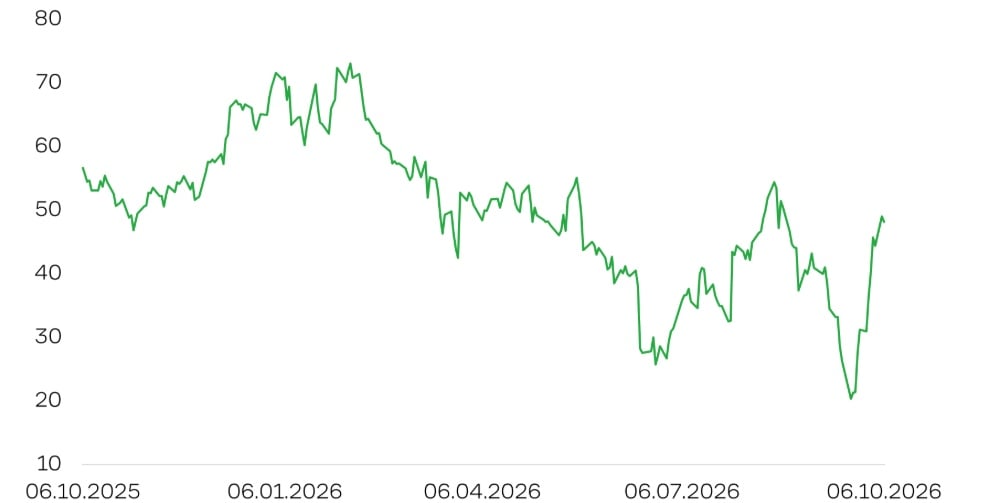
Financials fell 3.61% over the review period. Despite the recent rebound, the 10s2s Treasury spread remains narrower than at the start of the year. A flatter curve raises the risk of pressure on net interest margins, especially if further rate hikes push deposit costs higher faster than loan yields can reset. For banks, the key issue is not only how long the tightening cycle lasts, but how well they can contain funding costs.
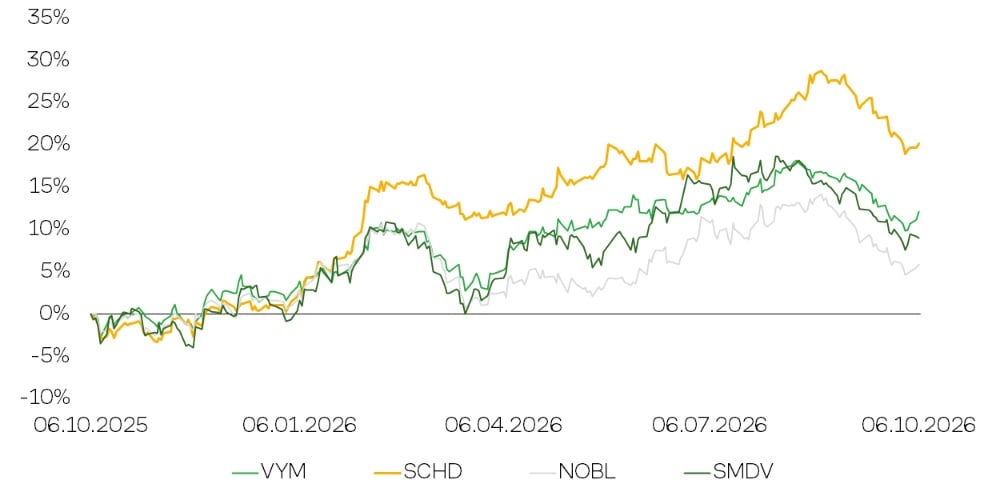
The risk of a longer Fed hiking cycle extends beyond Financials. For Utilities and Real Estate, higher risk-free yields make bonds more competitive while also increasing debt-servicing costs and the cost of new investment. The same dynamic is weighing on dividend stocks: higher bond yields reduce their relative appeal, while rising borrowing costs add further pressure on issuers. Declines in dividend-focused ETFs such as VYM, SCHD, NOBL and SMDV reflect that pressure.
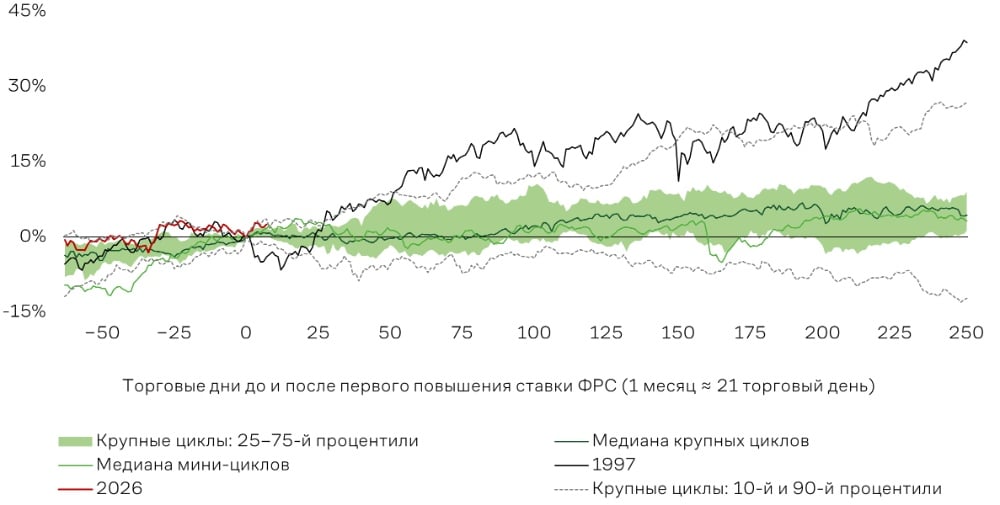
Still, the first rate hike does not automatically spell trouble for the broader market. In the historical sample shown, the S&P 500 delivered a median return of roughly 4.4% over the following 12 months in major hiking cycles and 3.2% in shorter cycles. A major cycle refers to an extended series of hikes, while a mini-cycle is a shorter sequence of increases. The standout exception was 1997, when the Fed stopped after a single hike and the index gained nearly 39% over the next year. The key question is how far the Fed ultimately goes and whether tighter policy is accompanied by slower growth and weaker corporate results. A rising broad index after the first hike can still coexist with sustained pressure on dividend stocks and companies that rely heavily on borrowed capital.
On the macro side, the key event was the September 30 release of August PCE data, which came in softer than expected. Headline PCE rose 0.31% MoM, below the 0.35% forecast, while core PCE increased by roughly 0.25% MoM, vs. 0.3% expected. The methodological revision provided an additional tailwind, lowering inflation estimates for prior months. Headline and core PCE rose 3.4% and 3.0% YoY, respectively. After the revision, core inflation averaged just 0.17% MoM over the three summer months, consistent with an annualized pace of around 2%. That weakens the case for further rate hikes.
September labor-market data, released on October 2, also came in softer than expected. Nonfarm payrolls rose by just 29k, well below the 90k consensus, while the previous two months were revised down by a combined 66k. The unemployment rate stood at 4.2%, although the underlying increase was marginal, from 4.14% to 4.18%. Average hourly earnings rose just 0.13% MoM, vs. 0.3% expected, while annual wage growth slowed to 3.0%. The report points more to persistently weak hiring without signs of overheating than to a sharp deterioration in the economy. Combined with softer inflation, that strengthens the case for a pause at the Fed’s October meeting, with the probability of no change in rates now at roughly 80%.
Market Focus
WTI fell 3%, slipping below $90/bbl. Prices came under pressure as Middle East oil exports recovered and the G7 moved to release strategic crude and diesel reserves. Geopolitical risk remains in the mix, however, with continued attacks on vessels near the Strait of Hormuz keeping the threat of renewed supply disruptions alive.
At the October 4 meeting, seven OPEC+ countries kept production quotas unchanged for a second straight month, leaving the November plan at the September level of a combined 31.01m bpd. A fresh risk to Red Sea oil flows came from the Yemeni government’s announcement, backed by Saudi Arabia, of a large-scale military operation against the Houthis, who had seized the port of Mocha and islands in the Bab el-Mandeb Strait.
U.S. Department of Energy data provided some support to crude. Despite a modest rise in production to 13.96m bpd, total crude and petroleum-product inventories fell by 7.8m barrels.
A new earnings season gets underway next week, as usual with the largest Wall Street banks. Several reports are likely to draw outsized investor attention.
On October 13, JPMorgan Chase will report Q3 2026 results. The bank heads into the release after a strong Q2, when revenue excluding significant one-off gains rose 15% YoY, while adjusted net income increased 13% to $16.9bn. EPS excluding those gains came in at $6.14, vs. reported EPS of $5.24 a year earlier. The main drivers were elevated client activity, a 35% jump in trading revenue and a 30% increase in investment-banking fees. Net interest income rose 10% to $25.6bn, although excluding markets it increased just 4%, as lower rates offset growth in loans and deposits. The key watchpoints will be the outlook for net interest income, fee resilience, expenses and credit quality. The consensus price target stands at $375.
On October 20, Netflix will report Q3 2026 results. The company heads into the release after a resilient Q2, when revenue rose 13.4% YoY to $12.6bn and net income increased by roughly 9% to $3.4bn. EPS climbed 11% to $0.80, supported by business growth and a lower share count following buybacks. The main growth drivers remain subscriber gains, price increases and expansion of the advertising business, where full-year revenue is expected to roughly double to $3bn. For Q3, management is guiding for revenue of $12.86bn, implying 11.7% YoY growth, net income of $3.45bn and EPS of $0.82. Operating margin is expected at 33.2%, vs. 28.2% a year earlier. The key watchpoints will be advertising revenue, subscriber response to pricing and content spending. The consensus price target stands at $92.
Broad Market Technical Setup
The S&P 500 has pushed toward 7,800 and remains above its 20- and 50-day moving averages, both clustered around 7,680–7,690. The RSI has risen to 60, signaling solid upside momentum without overbought conditions. Breadth remains the weak spot, however. Only 28% of index constituents are trading above their 50-day moving averages, leaving the rally unusually concentrated and keeping volatility risk elevated. We see the risk balance for the next two weeks as moderately positive. A break above the August high would open the way toward 8,000. Key support sits at 7,680–7,690. A break below that zone would raise the risk of a correction toward 7,510. As long as support holds, our base case remains further upside despite weak breadth.
Expected Trading Range
We expect the S&P 500 to trade between 7,690 and 8,000.