Investment Review №328. Waiting for change

Vadim Merkulov
Head of Analytics department
Adient. Automotive comfort services
ADNT shares are attractive for investment with a target price of around $29
About Company
Adient plc (ADNT) is the world’s leading manufacturer of automotive seats, serving nearly all major car makers. The company offers a comprehensive production cycle, encompassing everything from metal frames to the final upholstery for millions of vehicles globally. Adient’s primary sales markets include North America, South America, and Europe. Major clients such as Volkswagen Group (VOW3), Ford Motor Co. (F), and Stellantis N.V. (STLA) each contribute approximately 10% to Adient’s overall revenue.
| Ticker | ADNT |
| Share price as of analysis | $24,53 |
| Target share price | $29,2 |
| Growth potential | 19,04% |
| Stock vs Indices | Day | Week | Month | Quarter | Year |
| ADNT | (0,2%) | (1,1%) | 11,6% | 53,1% | 16,1% |
| S&P 500 | 0,2% | 0,5% | 1,7% | 8,2% | 20,1% |
| Russell 2000 | 0,2% | 1,8% | 8,0% | 12,3% | 14,5% |
| DJ Industrial Average | 0,3% | (0,1%) | 3,0% | 6,4% | 12,8% |
| NASDAQ Composite Index | 0,5% | 1,6% | 1,6% | 11,6% | 30,6% |
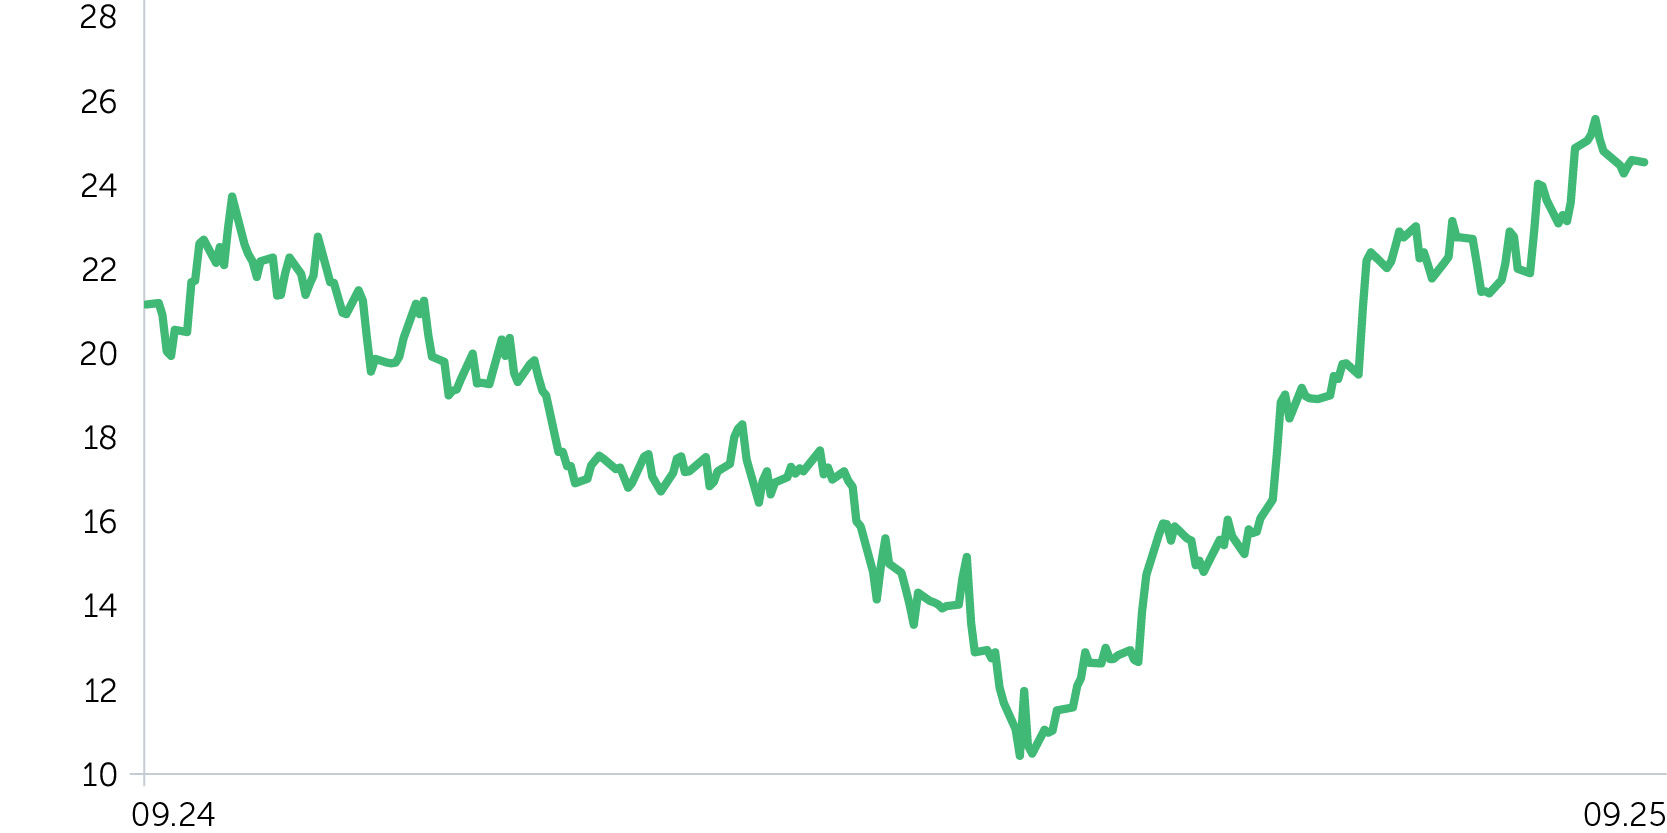
Price dynamics ADNT, $
Investment Thesis
- On April 3, 2025, the U.S. implemented a 25% tariff on imported cars, followed by a similar duty on auto parts on May 3. This move predominantly impacted the “Big Three” automakers (Ford, GM, Stellantis) as parts of their assembly and supply come from Canada and Mexico. However, a subsequent relaxation in tariff policies was announced, allowing manufacturers to reimburse up to 3.75% of a vehicle’s price to partially counteract the tariffs’ effect. Challenges for some frequently become opportunities for others. Even if automakers can mitigate tariff costs via government “compensations,” the need to shift production to the U.S. and reconfigure supply chains persists, as certain compensation options will cease to be available in the next year.
Adient’s production in North America, a region accounting for over 30% of its total revenue, is largely concentrated in the U.S., comprising 75% of the region’s capacity. The company expects that the production of approximately 600,000 vehicles will necessitate relocating manufacturing to the U.S. It has proactively presented proposals to some auto makers to streamline their production chains and boost the output of Adient products. We believe that these initiatives will enable the company to achieve a 3% year-over-year increase in revenue, reaching $14.9 billion in fiscal year 2026 (ending September 30, 2026), which would constitute a robust result in the context of a challenging industry landscape.
Net income for fiscal year 2026 is projected to grow more significantly. Despite the adversities faced in recent years—such as the pandemic, supply chain disruptions affecting automakers, and the 2025 U.S. import tariffs—Adient has consistently succeeded in reducing operating costs as a percentage of revenue, excluding one-time costs related to asset restructuring. The company has also made substantial strides in optimizing its European operations, where EBITDA margins declined to 2-3%. Furthermore, Adient is nearing the completion of its restructuring efforts in China and is poised to increase orders starting in fiscal year 2026. Operating EBITDA margins in this region stand at roughly 15%. The pivot from the European market to the Asian one may elevate net income to $438 million in fiscal year 2026, a stark increase from the $18 million net income in 2024 and an expected loss of $120 million in fiscal year 2025, based on FactSet’s consensus forecasts.
- Adient’s profit-sharing policy in recent quarters could potentially drive the stock up. In the third quarter of fiscal year 2025 (coincides with the second calendar quarter of 2025), the company allocated $50 million for share repurchases. This brings the total share buybacks in the first nine months of fiscal year 2025 to $75 million; therefore, Adient repurchased 4% of its outstanding shares. By the end of the second calendar quarter of 2025, cash constituted approximately 10% of total assets. This relatively strong liquidity position enables the company to continue repurchasing its shares in the forthcoming quarters. We believe that Adient could maintain this strategy of returning value to shareholders through buybacks, given the persistently high uncertainties related to trade restrictions in the U.S. automotive industry.
- We believe that ADNT stock has the potential for positive performance over the next 12 months. When analyzing a broad spectrum of publicly listed U.S. automotive OEMs, considering both their EV/EBITDA multiples and anticipated EBITDA growth rates, it is evident that ADNT is undervalued. With an anticipated average EBITDA growth rate of 24% over the next two years, we predict that Adient’s valuation could increase to approximately 10.0x, versus the current 8.4x. Therefore, we see a price target for ADNT at $29.20, aligning with an EV/EBITDA multiple of 10.0x.
The price target for the company is $29.20, with a “Buy” recommendation. We suggest setting a stop-loss at $22.00.
| Marginality % | 2022A | 2023A | 2024A | 2025E | 2026E | 2027E | 2028E | 2029E | 2030E |
| Gross margin | 6% | 7% | 6% | 7% | 8% | 8% | 8% | 9% | 8% |
| EBITDA Non-GAAP (non-adj) margin | 4% | 6% | 5% | 3% | 7% | 7% | 8% | 7% | 7% |
| Net Income margin | -1% | 1% | 0% | -2% | 3% | 3% | 4% | 4% | 4% |
| Ratio Analysis | 2024A | 2025E | 2026E | 2027E | 2028E | 2029E | 2030E |
| ROE | 13,8% | 7,7% | 27,7% | 27,4% | 25,8% | 22,8% | 20,3% |
| ROA | 0,2% | -2,5% | 5,0% | 5,4% | 6,7% | 6,2% | 5,9% |
| ROCE | 7,1% | 4,6% | 17,4% | 20,4% | 20,1% | 18,4% | 16,8% |
| Sales/Assets | 1,57x | 1,61x | 1,70x | 1,67x | 1,71x | 1,65x | 1,61x |
| Interest Coverage | 1,24x | 2,36x | 1,61x | 0,83x | 6,85x | 6,16x | 13,44x |
| Financial performance, $ mn | 2022A | 2023A | 2024A | 2025E | 2026E | 2027E | 2028E | 2029E | 2030E |
| Revenue | 14 121 | 15 395 | 14 688 | 14 482 | 14 899 | 16 132 | 17 301 | 18 419 | 19 707 |
| Cost of sales | 13 314 | 14 362 | 13 760 | 13 503 | 13 714 | 14 809 | 15 847 | 16 854 | 18 032 |
| Gross Income | 807 | 1 033 | 928 | 979 | 1 185 | 1 323 | 1 453 | 1 566 | 1 675 |
| SG&A | 598 | 554 | 507 | 507 | 480 | 500 | 536 | 608 | 690 |
| EBITDA Non-GAAP (non-adj) | 628 | 852 | 682 | 503 | 1 056 | 1 196 | 1 325 | 1 370 | 1 420 |
| Depreciation and Amortization | 350 | 340 | 332 | 324 | 296 | 297 | 306 | 308 | 328 |
| EBIT Non-GAAP (non-adj) | 278 | 512 | 350 | 178 | 759 | 900 | 1 019 | 1 062 | 1 092 |
| Interest Expenses | 224 | 217 | 217 | 215 | 111 | 146 | 76 | 94 | 92 |
| EBT | 54 | 295 | 133 | -37 | 648 | 754 | 943 | 968 | 1 000 |
| Taxes | 94 | 0 | 32 | 99 | 125 | 146 | 182 | 187 | 193 |
| Net Income GAAP | -120 | 205 | 18 | -227 | 438 | 523 | 676 | 695 | 721 |
| Diluted EPS GAAP | $-1,27 | $2,15 | $0,20 | $-2,64 | $5,09 | $6,08 | $7,86 | $8,09 | $8,39 |
| DPS | $- | $- | $- | $- | $- | $- | $- | $- | $- |