Investment Review №329. It's time to take a risk
Review as of September 23
Global Perspective
Over the past two weeks, the S&P 500 index increased 3.0%, with the Nasdaq 100 outperforming at a 4.5% gain. Investor attention also gravitated towards small-cap companies, evidenced by the Russell 2000's 2.8% rise, marking a new historical high for the first time since 2021. Despite these gains, market breadth remained constrained. The bulk of the S&P 500's growth was driven by the mega-cap equity segment, with only 45% of the stocks posting positive returns. In contrast, 87% of the top 15 companies by market capitalization advanced. In the technology sector, alongside the small-cap focus, there was a discernible shift toward growth stocks and long-duration assets, which is reflected in the expanded breadth of these indices.
Market breadth: share of companies with positive returns
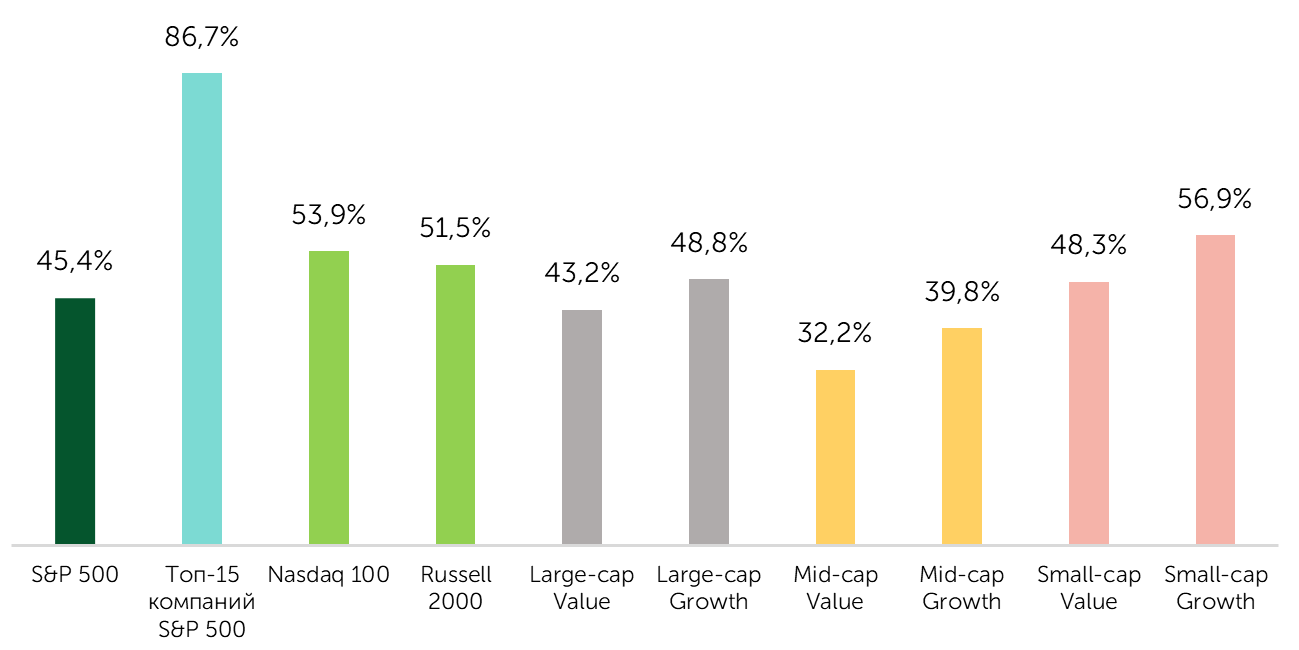
Source: FactSet, Freedom Broker analysis
Broad market indices, along with several sub-segments, continued to reach historical highs, driven primarily by the recent Federal Reserve meeting. As anticipated, the Fed reduced the interest rate by 25 basis-points (bps) to a range of 4.0-4.25% per annum. Market participants, however, sought further insights from the Fed's updated macroeconomic forecasts. A pivotal factor supporting the market was the updated September forecast, which lowered the projected future interest rate trajectory to 3.6% in 2025 and 3.4% in 2026. This update affirmed the Fed's intention to cut rates in October and December 2025 while highlighting its cautious stance on rate reductions in 2026. The market interpreted this as a positive signal, leading to an increased likelihood of two consecutive rate cuts before year-end, subsequently bolstering risk assets.
According to data from Polymarket, the probability of a 25-bps rate cut in October stands at 83%, while the likelihood of a 50 bp reduction is 4%. For December, the chances of a 25-bps cut are at 72%, with a 6% probability for a 50-bps cut. Consequently, Polymarket forecasts a probability of easing in October and December at 87% and 78%, respectively. This implies a 68% probability of two cuts by year-end. In contrast, futures markets present a more dovish perspective, indicating a 72% probability of two rate cuts by the end of 2025. Freedom Broker's analytical team's base case scenario aligns with market expectations, also anticipating a total of 50 bps reduction across two rate cuts.
Following the Federal Reserve meeting, the futures market showed little initial reaction to the Fed's forecast of a single rate cut in 2026. However, only days later, market sentiment adjusted, incorporating a more hawkish outlook for 2026. Expectations shifted from anticipating three rate cuts to two, with the probability of two rate cuts currently estimated at approximately 70%.
| Meeting | 2,50% - 2,75% | 2,75% - 3,00% | 3,00% - 3,25% | 3,25% - 3,50% | 3,50% - 3,75% | 3,75% - 4,00% | 4,00% - 4,25% |
| October 2025 | 0,0% | 0,0% | 0,0% | 0,0% | 0,0% | 91,9% | 8,1% |
| December 2025 | 0,0% | 0,0% | 0,0% | 0,0% | 73,5% | 24,9% | 1,6% |
| January 2026 | 0,0% | 0,0% | 0,0% | 30,9% | 53,0% | 15,1% | 0,9% |
| March 2026 | 0,0% | 0,0% | 14,0% | 40,9% | 35,9% | 8,7% | 0,5% |
| April 2026 | 0,0% | 3,2% | 20,1% | 39,8% | 29,7% | 6,8% | 0,4% |
| June 2026 | 1,8% | 12,7% | 31,1% | 34,1% | 16,9% | 3,2% | 0,2% |
| July 2026 | 5,0% | 18,2% | 32,0% | 29,0% | 12,8% | 2,3% | 0,1% |
| August 2026 | 9,5% | 22,9% | 31,0% | 23,5% | 9,3% | 1,6% | 0,1% |
| October 2026 | 11,4% | 24,0% | 29,9% | 21,5% | 8,2% | 1,4% | 0,1% |
| December 2026 | 13,5% | 25,0% | 28,5% | 19,3% | 7,0% | 1,1% | 0,1% |
Source: FactSet, Freedom Broker
The Federal Reserve has revised its GDP growth rate projections upwards, estimating a 1.6% y/y increase in 2025 and a 1.8% rise in 2026. Meanwhile, forecasts for the unemployment rate remain steady, projected at 4.5% by the end of 2025 and 4.4% by the end of 2026. However, the Fed has slightly adjusted its core inflation forecast for 2026, raising it to 2.6% y/y, while maintaining the 2025 forecast unchanged at 3.1% y/y.
In the realm of corporate developments, market speculation intensified around the theme of increasing governmental influence. The Trump administration is considering acquiring up to 10% of Lithium Americas (LAC), a move that has seen the company’s stock price double following the announcement. This strategic acquisition is aimed at securing control over the U.S. lithium supply chain and diminishing dependence on China for processing this critical mineral. Significant corporate activity was also observed in the big-tech sector. Oracle Corp. (ORCL) reported a remarkable 359% y/y growth in Remaining Performance Obligations (RPO), reaching $455 billion, which propelled its stock to rise 36% by the end of trading on September 10. In a notable development, Nvidia Corp. (NVDA) unveiled a $5 billion investment in Intel Corp. (INTC), equating to over 4% of Intel’s equity. This announcement on September 18 spurred a 23% increase in Intel shares, while Nvidia shares gained 3.5%. Meanwhile, CrowdStrike, at its investor day, projected net new annualized recurring revenue growth of at least 20% in FY2027, versus 17% expected in FY2026. This optimism saw its shares climb 13% by the close of trading on September 18.
Market Focus
The upcoming labor market data release for September, scheduled for October 3, will be pivotal over the next two weeks. Previously, August's figures for non-farm employment and the unemployment rate indicated a softening in the labor market. As we anticipate the September statistics, market projections suggest an increase in non-farm employment to 43,000, rising from 22,000 in August, with the unemployment rate predicted to remain steady at 4.3%.
Despite the anticipated rise in employment figures month-over-month, the labor market exhibits signs of weakening. This supports the Federal Reserve's decision to pivot its focus from inflation to employment within the economy. Based on our analysis, the trend in net hiring stands at 45,000 per month, which is significantly below the estimated equilibrium level of 130,000 per month. This equilibrium point of net hiring reflects the increase in labor supply needed to sustain a long-term real GDP growth rate of 2.1% per annum.
Nonetheless, under our base case scenario, we do not foresee a deterioration in the labor market. The Fed's rate cuts and the anticipated recovery in interest expenses are the primary factors supporting this outlook. Concurrently, we project that net hiring will strengthen to an average of at least 100,000 people per month by the May-August 2026 period, at the earliest. In this context, a temporarily constrained growth in labor supply, resulting from restrictive migration policies, is acting as a mitigating factor against rising unemployment rates.
Conversely, the Federal Reserve's September projections align with a Goldilocks scenario, suggesting that rate cuts may offset the current labor market weakness. Furthermore, an acceleration of the easing cycle combined with a potential uptick in economic activity in 2026 is likely to bolster a market rally, particularly in rate-sensitive sectors. Therefore, we recommend maintaining increased exposure to sectors such as IT, Healthcare, Financials, Consumer Discretionary, and Utilities. Moreover, potential market drawdowns should be considered optimal opportunities to strengthen positions.
Small-Cap Stocks
Over the past two weeks, the small-cap segment has continued to benefit from capital inflows, although the growth has slowed compared to late August and early September. The Russell 2000 (ETF: IWM) gained 2.8%, while the S&P Small Cap 600 (ETF: IJR) rose by 0.4%. Meanwhile, investors have increasingly shifted their attention to micro-cap stocks, with the Russell Microcap (ETF: IWC) recording a substantial increase of 5.6%. Notably, the Russell 2000 closed at a record high for the first time since 2021, while the micro-cap index needs another 4.7% to reach its peak, which we estimate could occur before year-end.
The primary driver of growth over the past two weeks was the Fed meeting. The updated forecasts lowered the key interest rate trajectory to 3.6% for 2025 and 3.4% for 2026. This confirmed a willingness to implement further rate cuts in October and December this year, while indicating a more cautious stance for 2026. The market, however, focused on the short-term scenario of two rate cuts before the end of 2025, which bolstered demand for risk assets and enabled the Russell 2000 to achieve a new high.
We maintain a cautiously optimistic short-term outlook for the small-cap segment, driven by expectations of two rate cuts and early signs of small companies emerging from an earnings recession, as we have previously noted. The key event to watch in the next two weeks will be the release of U.S. labor market data on October 3rd, which could adjust expectations for the rate trajectory and influence the further performance of the segment.
Technical Analysis of the Broad Market
The technical outlook for the broad market index remains generally favorable. Despite the reduction in market breadth, the performance of the stocks of companies within the S&P 500 index, even amidst the renewal of historical highs, does not indicate an overbought condition. Notably, only 5.6% of companies have an RSI above 70 (the threshold for overheating), compared to the 5-year average of 6.7%. The proportion of companies trading above their 50-day moving average stands at 54%, which does not suggest an overheated market either, as the 5-year average is 57%.
Expected Trading Range
We expect the S&P 500 to trade in the 6,550–6,750 range.