Investment Review №333. Right to hedge

Vadim Merkulov
Head of Analytics department
EOG Resources. Shale Classic
EOG shares are attractive for purchase in the medium term with a target price of $125
About company
EOG Resources, Inc. (EOG) engages in the exploration, development, production and marketing of crude oil and natural gas. The company’s operations are concentrated in North America, with the United States accounting for approximately 98% of its revenue. EOG Resources was founded in 1985 and is headquartered in Houston, Texas.
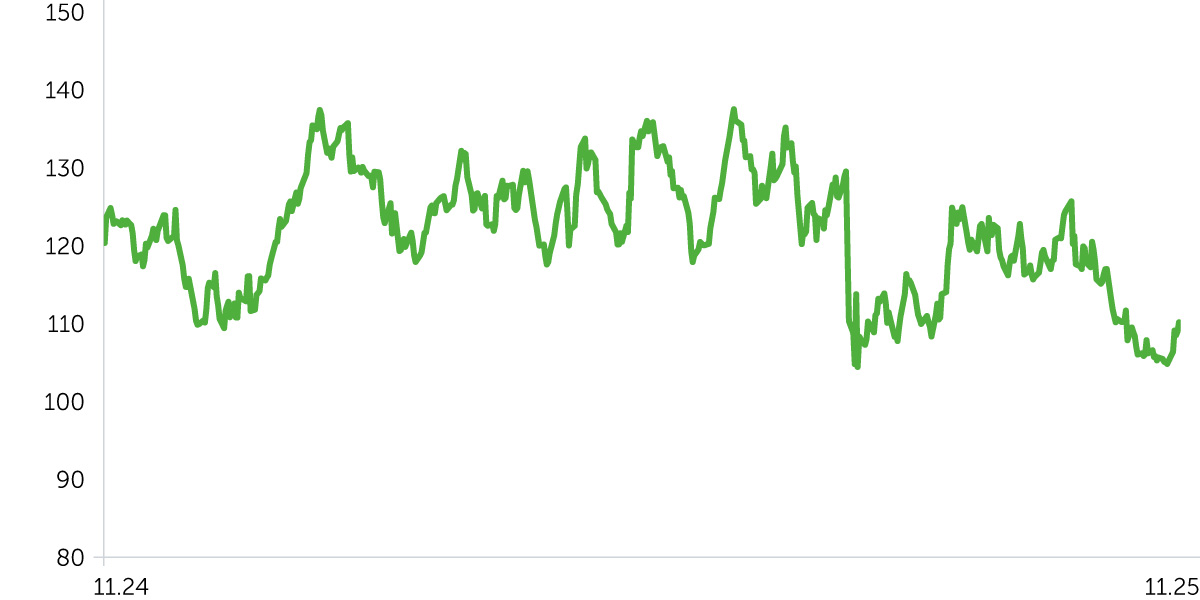
A decline in oil prices in 2025, driven by increased production in OPEC+ countries, has put downward pressure on EOG’s share price. The company’s share price has fallen by 9.9% YTD (all share price data referenced as of market close on November 14). In our view, EOG Resources’ shares have upside potential for several reasons.
| Ticker | EOG |
| Share price as of analysis | $110,40 |
| Target share price | $125 |
| Growth potential | 13,2% |
| Share price dynamics vs. indices | Day | Week | Month | Quarter | Year |
| EOG | 1,1% | 4,7% | 1,2% | (7,8%) | (18,3%) |
| S&P 500 | (0,1%) | 0,1% | 1,4% | 4,1% | 13,2% |
| Russell 2000 | 0,2% | (1,8%) | (4,3%) | 3,9% | 2,2% |
| DJ Industrial Average | (0,7%) | 0,3% | 1,9% | 5,0% | 7,8% |
| NASDAQ Composite Index | 0,1% | (0,5%) | 1,7% | 5,5% | 19,9% |
Price dynamics EOG, $
Key Investment Theses
- Improvement in operating and financial performance through asset acquisition. On August 1, EOG Resources closed a $5.6 billion acquisition of upstream assets. The deal adds 675,000 acres to the company’s position in the Utica Shale, expanding its total footprint in the formation to 1.1 million acres. As a result, EOG’s undeveloped reserves have increased to over two billion barrels of oil equivalent. As a result, EOG’s undeveloped reserves have increased to over two billion barrels of oil equivalent. The combined projected production volume stands at 275,000 barrels of oil equivalent per day, positioning the company as a leading operator in the Utica Shale. Management expects first-year synergies following the deal’s close to reach up to $150 million. As of the third quarter of 2025, EOG’s total production rose by 21% y/y to 1.3 million barrels of oil equivalent per day. Natural gas output rose 39.3% y/y to 2.7 billion cubic feet per day. We view the transaction positively. The company’s low debt burden enables it to acquire producing assets at attractive prices amid ongoing weakness in the oil market.
- Rising gas demand and prices during the heating season. On November 13, 2025, U.S. natural gas prices reached their highest level since 2022 ($4.65 per million British thermal units). The U.S. Department of Energy forecasts that domestic natural gas consumption will rise by 17.2% m/m in November and by an additional 16.9% m/m in December, reaching 93.1 billion cubic feet per day (Bcf/d) and 108.8 Bcf/d, respectively.
Furthermore, natural gas prices in the United States may continue to increase due to the commissioning of new liquefied natural gas (LNG) production and export capacity. The U.S. Department of Energy projects U.S. LNG exports to increase by 23.6% y/y in 2025 and 10.2% y/y in 2026, to 14.7 Bcf/d and 16.3 Bcf/d, respectively.
Over the next several years, gas demand is also expected to rise as the number of data centers continues to increase. - High dividend yield and share repurchase. This year, management raised the quarterly dividend by 4.6% to $1.02 per share. The dividend yield currently stands at an impressive 3.7% per annum.
In addition to dividends, EOG continues to return capital to shareholders through share repurchases. Over the first nine months of 2025, the company spent $1.9 billion on buybacks. The number of outstanding shares declined by 0.4% q/q (−4.2% y/y) in the third quarter of 2025.
In our view, EOG shares have medium-term upside potential of 13%. Our 12-month target price for stock is $125, and our recommendation is Buy. A stop-loss level is recommended at $101.6.
| Ratio Analysis | 2022А | 2023А | 2024А | 2025E | 2026E | 2027E | 2028E | 2029E |
| ROE | 34% | 25% | 23% | 19% | 20% | 20% | 20% | 20% |
| ROA | 20% | 16% | 14% | 11% | 12% | 12% | 12% | 12% |
| ROCE | 30% | 23% | 20% | 16% | 18% | 18% | 18% | 18% |
| Sales/Assets | 0,6x | 0,6x | 0,5x | 0,5x | 0,5x | 0,5x | 0,5x | 0,5x |
| Interest Coverage | 61,0x | 61,7x | 61,9x | 30,3x | 27,9x | 29,2x | 30,2x | 31,5x |
| Margins, % | 2022A | 2023A | 2024A | 2025E | 2026E | 2027E | 2028E | 2029E |
| Gross margin | 56% | 58% | 56% | 54% | 54% | 55% | 56% | 56% |
| EBITDA margin | 56% | 51% | 52% | 52% | 53% | 54% | 54% | 54% |
| Net profit margin | 33% | 29% | 28% | 24% | 25% | 25% | 25% | 25% |
| Financials, $mln | 2022А | 2023А | 2024А | 2025E | 2026E | 2027E | 2028E | 2029E |
| Revenue | 25 702 | 24 186 | 23 698 | 23 238 | 25 364 | 26 433 | 27 536 | 28 685 |
| COGS | 11 197 | 10 248 | 10 439 | 10 766 | 11 715 | 11 882 | 12 170 | 12 587 |
| Gross Income (adj.) | 14 505 | 13 938 | 13 259 | 12 472 | 13 649 | 14 551 | 15 366 | 16 098 |
| SG&A | 570 | 640 | 669 | 753 | 769 | 762 | 773 | 785 |
| EBITDA (adj.) | 14 342 | 12 385 | 12 375 | 12 016 | 13 355 | 14 386 | 14 929 | 15 559 |
| D&A | 3 542 | 3 492 | 4 108 | 4 492 | 4 633 | 4 788 | 4 934 | 5 092 |
| Interest expense (income) | 179 | 148 | 138 | 245 | 300 | 300 | 300 | 300 |
| Pretax Income (adj.) | 10 735 | 8 979 | 8 403 | 7 170 | 8 080 | 8 461 | 8 765 | 9 135 |
| Income Taxes Paid | 2 316 | 2 035 | 1 726 | 1 506 | 1 697 | 1 777 | 1 841 | 1 918 |
| Net Income (adj.) | 8 419 | 6 944 | 6 677 | 5 664 | 6 383 | 6 684 | 6 925 | 7 217 |
| Dilluted EPS | $14,34 | $11,89 | $11,74 | $10,42 | $12,26 | $13,43 | $14,45 | $15,66 |
| DPS | $8,80 | $5,80 | $3,64 | $3,95 | $4,12 | $4,28 | $4,44 | $4,61 |