
Investment Review №336. Choosing a direction
Market Environment as of January 12, 2026
Spotlight on Earnings Season and the Ongoing “Goldilocks” Pricing Trend
Global Perspective
Over the past two weeks, the U.S. equity rally continued to broaden, as shown by the equal‑weighted S&P 500 (+2.2%) outperforming its market‑cap‑weighted counterpart (+1.0%). In contrast, technology momentum slowed: the Nasdaq 100 advanced only 1.0%, while investor attention shifted toward mid‑ and small‑cap segments. The S&P Mid Cap 400 gained 3.4%, the S&P Small Cap 600 rose 3.3%, and the standout beneficiary was the Russell 2000, which climbed 4.7%.
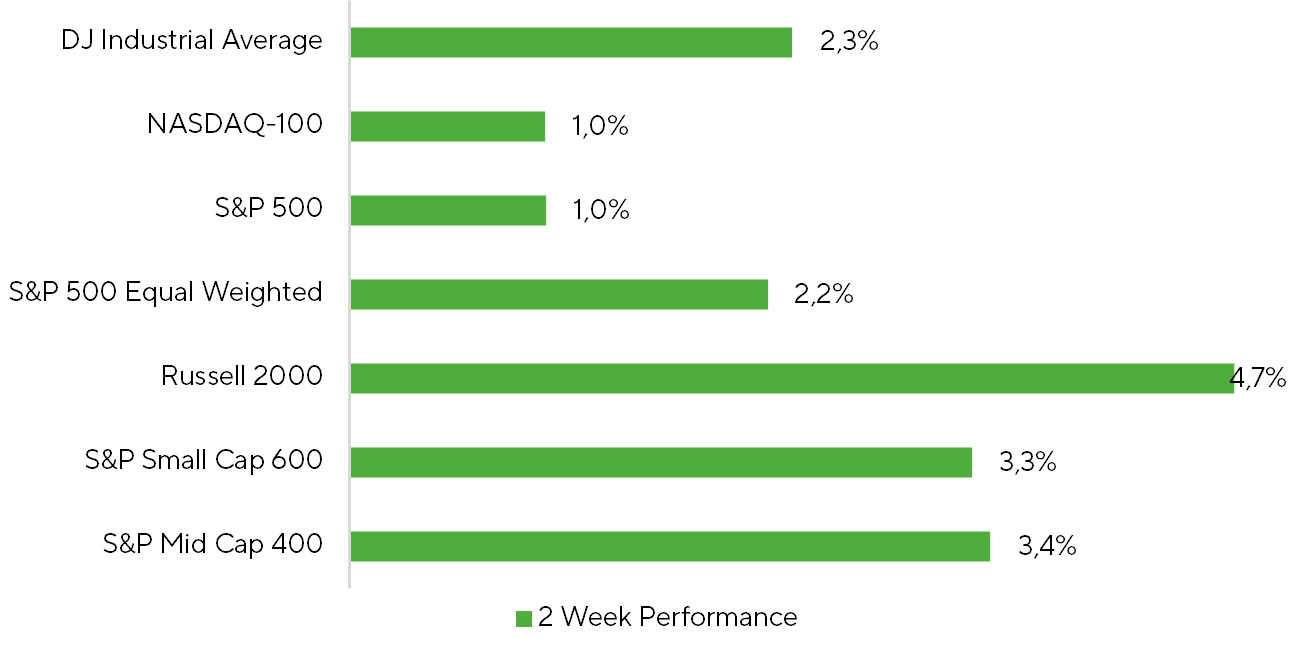
Source: Bloomberg, Freedom Broker
At present, the key market driver is no longer Federal Reserve policy, as was the case in late 2025, but rather the gradual pricing‑in of a “Goldilocks” scenario for 2026. This outlook envisions steady economic growth without overheating, accompanied by a normalization of inflationary pressures. The emergence of such expectations has bolstered demand for pro‑cyclical sectors and encouraged a reallocation of capital toward areas more sensitive to the phase of the economic cycle.
An important factor reinforcing the pricing of the Goldilocks scenario was the delayed release of the first estimate of U.S. GDP for Q3 2025, published on December 23. The report exceeded most market expectations, reflecting resilient consumer spending and solid net export dynamics. Real GDP grew 4.3% QoQ annualized and 2.3% YoY. For comparison, the consensus forecast had projected +3.3% QoQ annualized, while individual analyst estimates were largely in the +2.8–3.8% range. Additional support for market sentiment came from abnormally low inflation readings in October–November, which strengthened the case for an economy transitioning into a regime of steady GDP growth alongside easing inflationary pressures. Taken together, these developments boosted investor risk appetite and underpinned the performance of cyclical equities.
The pro‑cyclical nature of the current market move is also confirmed by breadth indicators, which track the share of companies posting positive returns over the period. Within the S&P 500, the broadest participation was recorded in Materials (92.9%), Industrials (82.7%), and Consumer Discretionary (72.2%). Among non‑cyclical sectors, Health Care stood out, with 72.6% of constituents advancing. This performance is linked to the favorable regulatory and policy environment established in 2025. A similar picture emerged in the Small‑Cap segment: within the S&P Small Cap 600, the strongest breadth was observed in Materials (96.4%), Industrials (85.9%), and Consumer Discretionary (83.7%).
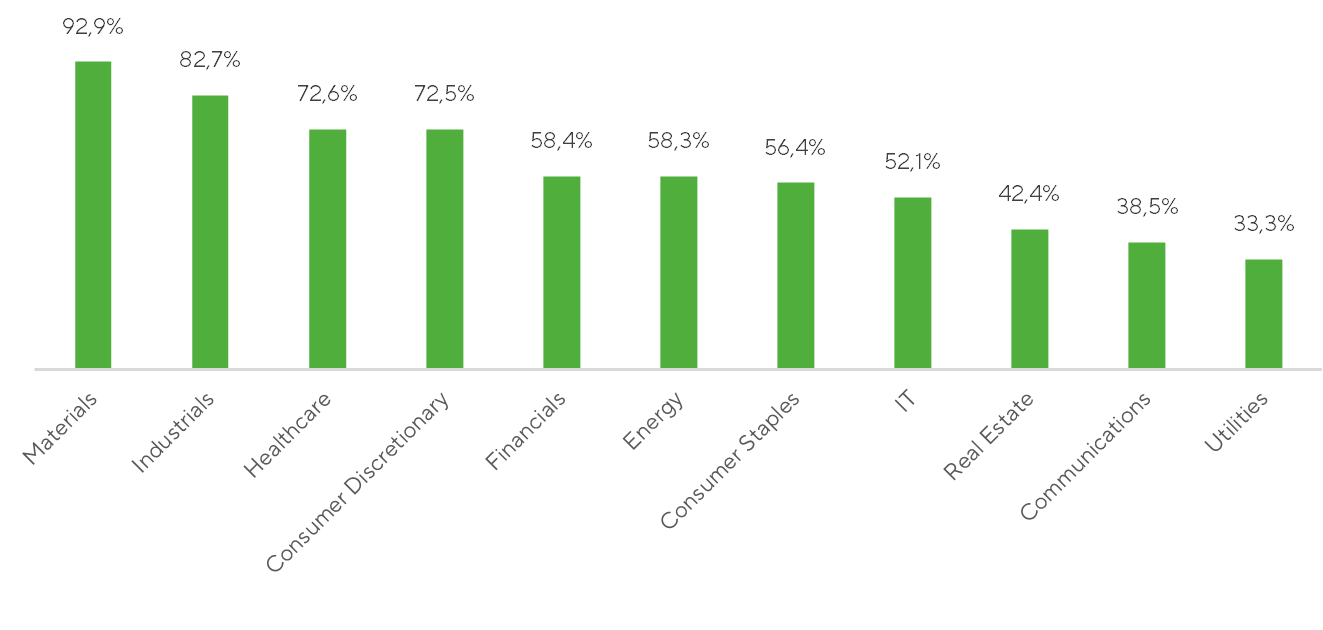
Market breadth: portion of companies with positive return. Source: Bloomberg, Freedom Broker
Nevertheless, while the U.S. market on the surface reflects rising risk appetite and a pro‑cyclical tilt consistent with a strong‑economy scenario, the underlying news flow remains dense and often contradictory. In several instances, it has stood in clear contrast to the prevailing positive sentiment. The primary source of such headlines once again has been U.S. President Donald Trump.
On January 3, reports of a U.S. military operation in Venezuela and heightened speculation about potential political changes in the country led markets to begin pricing in the possibility of American oil majors returning to Venezuela. By January 5, the energy sector of the S&P 500 had reached a new all‑time high. However, the optimism proved short‑lived and was quickly followed by a pullback. In our assessment, investments in Venezuela’s oil industry under current conditions—with relatively low commodity prices and a persistent supply surplus—appear economically unjustified. Proposals from the U.S. administration to subsidize American companies for developing Venezuela’s oil sector are, at this stage, perceived more as political rhetoric than as a realistic investment scenario.
On January 12, reports emerged in the U.S. of a criminal investigation into Federal Reserve Chair Jerome Powell, intensifying debate over administrative pressure on the central bank’s leadership. Such developments potentially raise the political premium embedded in future Fed decisions and heighten uncertainty around the institution’s independence. Powell himself described the events as an attempt to influence the Fed’s policymaking. While the logic of the Trump administration’s actions makes this outcome not entirely unexpected, we currently assess the real risks to Powell and the Fed’s functioning as limited. More serious consequences would require proof of deliberate violations, and the judicial system may not necessarily side with the administration. Market reaction broadly reflects this view: for now, the issue is being largely discounted by investors.
During the period under review, investor attention increasingly turned to the defense sector, a logical consequence of rising geopolitical tensions in Central and Latin America, escalating frictions around Iran, and active debate over strategic control of Greenland. On January 8, President Donald Trump announced his intention to raise the U.S. defense budget to roughly $1.5 trillion. We believe the initial positive market reaction was largely driven by the combination of recent assertive foreign‑policy statements and actions, which in the short term provided support for defense‑related equities.
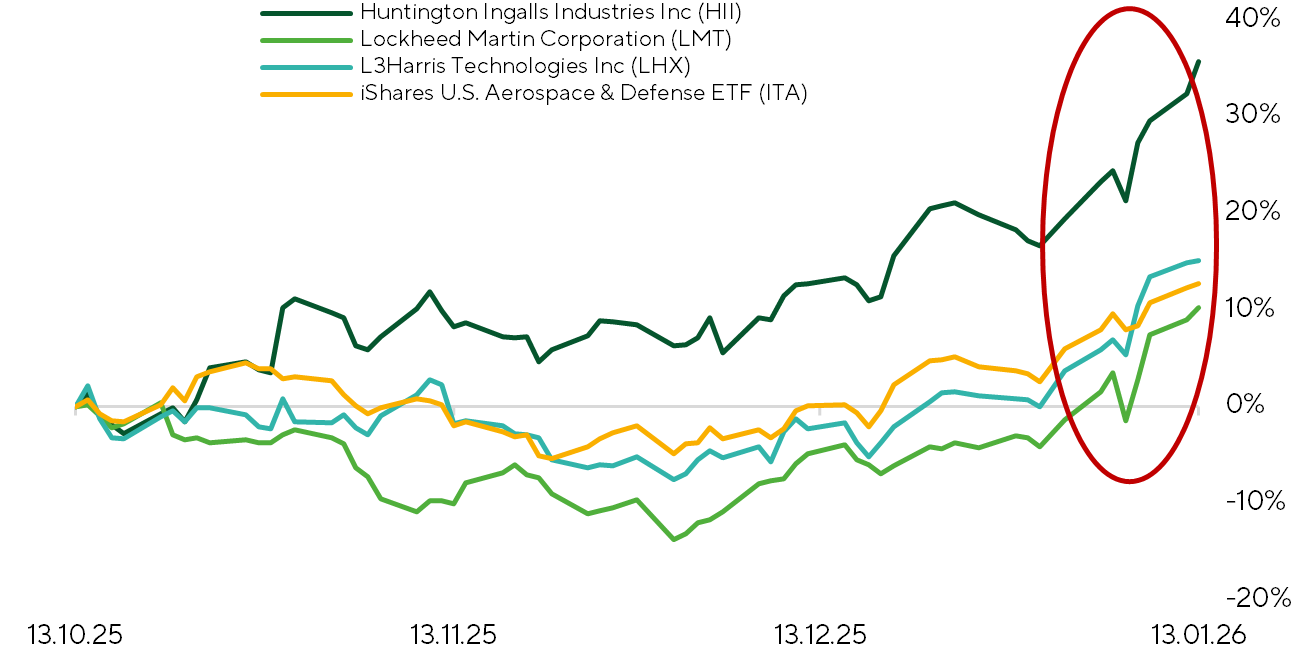
Normalized returns of defense companies’ stocks. Source: Bloomberg, Freedom Broker
In the financial sector, the Trump administration emerged as a catalyst for increased market volatility. On January 10, reports of a proposed policy to impose a 10% annual cap on credit card interest rates sparked immediate concern among investors, leading to a sharp sell-off in consumer finance stocks. The initiative is largely viewed by the market as campaign rhetoric, aimed at signaling protection of consumer interests. The most sensitive group of issuers were credit‑card specialists, including Synchrony Financial (SYF), Capital One (COF), Bread Financial (BFH), and American Express (AXP). Pressure on these stocks reflects the nature of their business models, where interest income is critical to offsetting credit risk and expected losses on unsecured lending.
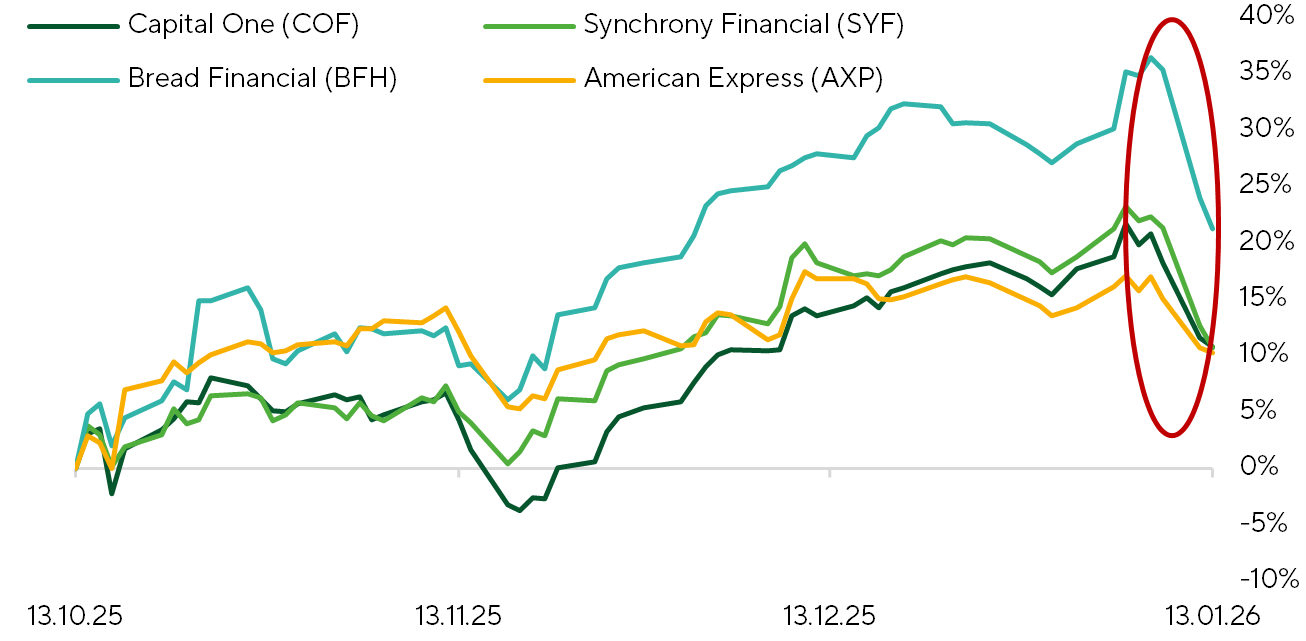
Normalized returns of financial institutions’ stocks. Source: Bloomberg, Freedom Broker
Market Focus
We expect the dense news flow to persist at least through the end of January. Despite the limited predictability of geopolitical events, the market is likely to gradually shift its focus toward the Q4 2025 earnings season, which is gaining momentum and becoming a key source of new information for market participants.
An additional factor that may bolster market sentiment is the release of the first estimate of U.S. Q4 2025 GDP. According to our nowcast model, Q4 GDP growth is estimated at 2.4% annualized, implying 2025 GDP growth of 2.46% (Q4 over Q4). This is well above current consensus expectations, which are close to 1.8%. Should the data surprise to the upside relative to consensus, a moderately positive market reaction is likely.
The large‑cap equity segment is entering the final stretch of the 2025 earnings season with quite solid expectations. According to FactSet consensus forecasts, Q4 EPS growth is expected to reach +7.9% YoY. Under this scenario, S&P 500 companies would end 2025 with aggregate EPS growth of 12.4% YoY. This outcome would fall between our base‑case and optimistic scenarios, under which we project full‑year EPS growth of 12.0% and 12.5%, respectively.
In the small cap segment, we expect more pronounced swings in aggregate EPS for Q4, largely due to the effect of low base. FactSet consensus currently implies EPS growth of 22.4% YoY in Q4 and 16.4% for calendar year 2025. The anticipated recovery momentum would mark the segment’s exit from an earnings recession and would represent the first year since 2022 in which the index shows positive 12‑month EPS growth.
Between January 19 and January 31, 117 S&P 500 constituents, 64 S&P Small Cap 600 issuers, and 126 Russell 2000 companies are scheduled to report, making the second half of January a key phase of the current earnings season.
Although the earnings calendar is packed with high‑profile names, there are two corporate releases that we consider to be of particular interest.
On January 20, streaming giant Netflix (NFLX) is scheduled to report its results. The stock has come under pressure in recent weeks amid M&A discussions with Warner Bros. (WBD) and price competition for media company Paramount–Skydance (PSKY). After the Warner Bros. board rejected Paramount–Skydance’s second offer and signaled a preference for a potential merger with Netflix, NFLX shares have shown signs of stabilizing. Fundamentally, Netflix remains on solid footing. The company continues to expand its global subscriber base, creating additional drivers for growth through price increases, while maintaining a low churn ratio. Netflix also increases advertising revenue from its ad-supported subscription tier, a model that is now being actively integrated into the company’s business. If a transaction with Warner Bros. is successfully completed, Netflix could emerge as the largest media holding company, combining leading streaming platforms with major film and television studios. If the deal is blocked by antitrust regulators, Netflix would be required to pay Warner Bros. a one-time fee of $5.8 billion. We expect Netflix to deliver moderately positive fiscal Q4 2025 results and to slightly exceed consensus revenue expectations, driven primarily by higher advertising revenue and strong December content releases, including the final season of Stranger Things and sportscasts. We project operating margin at least in line with consensus, reflecting higher marketing spend around key premieres. Our 12‑month price target for Netflix shares is $107.
Microsoft (MSFT) is scheduled to report earnings on January 28. Since the release of its previous quarterly report in late October, the share price has declined by about 13%, reflecting investors’ increasing concerns about the scale and growth trajectory of capital expenditures related to artificial intelligence development. Despite strong operating and financial results last quarter, the market reacted negatively to the report, because of a sharp increase in CAPEX and limited detail from management regarding the timing and mechanisms of AI monetization. In the upcoming release, investors will again focus on management’s commentary around the level of AI infrastructure investments and the expected return on those investments. Given sustained robust demand for cloud computing capacity and solid PC shipment dynamics in the past quarter, we anticipate strong financial results from Microsoft for the reporting period. However, rising costs of electronic components, particularly memory chips, could pressure PC demand in 2026. This may prompt Microsoft’s management to adopt a more conservative tone in their forward guidance. Another factor shaping the expectations backdrop is that several major investment banks have already revised their forecasts downward ahead of the print. This, in turn, sets consensus expectations at a more comfortable level and leaves room for potential positive surprise in the event of strong results or more confident commentary from management. Overall, we see meaningful medium‑term upside potential for MSFT shares. However, the near‑term market reaction to the upcoming report will be highly dependent on management’s messaging around the AI strategy and the pace of monetization of related investments, which, in the current environment, remains a key source of uncertainty. Our 12‑month price target for Microsoft stock is $600 per share.
Technical Broad Market Analysis
The S&P 500 staged a rally at the turn of December and January, setting new all-time highs. The index is now testing resistance just below the psychologically important 7,000 level. Meanwhile, the share of constituents trading above their 200-day moving average has climbed to a three-month high of 65%, signaling an improvement in the movement structure. The RSI suggests there is still room for further upside, with no signs of overbought conditions, and moving averages also confirm a positive trend. We expect the bullish tone in the market to persist over the coming weeks. Key support levels for the broad market index are located at 6,800 and 6,900 points.
Expected Trading Range
We anticipate the S&P 500 to move in the range of 6,800–7,100 points.