Investment Review №338. Change in Direction
Review as of February 10
Global Perspective
Over the past two weeks, the rally continued expanding, though volatility picked up with wider intraday swings. The major benchmarks closed mixed: the S&P 500 traded largely sideways, up just 0.2%, while the Dow Jones Industrial Average performed better, rising 1.5%. On February 6, the DJIA crossed the historically important 50,000 mark and traded steadily above that threshold during the session. In contrast, the tech-heavy Nasdaq 100 came under pressure and ended the period down 1.7%. The rally persisted beyond the mega-cap cohort as investors broadened their focus to small- and mid-cap names. In this setup, the S&P 500 Equal Weight Index gained 1.6% over the two weeks, whereas the S&P SmallCap 600 and S&P MidCap 400 advanced 3.0% and 3.2%, respectively, underscoring wider market participation in the upswing.
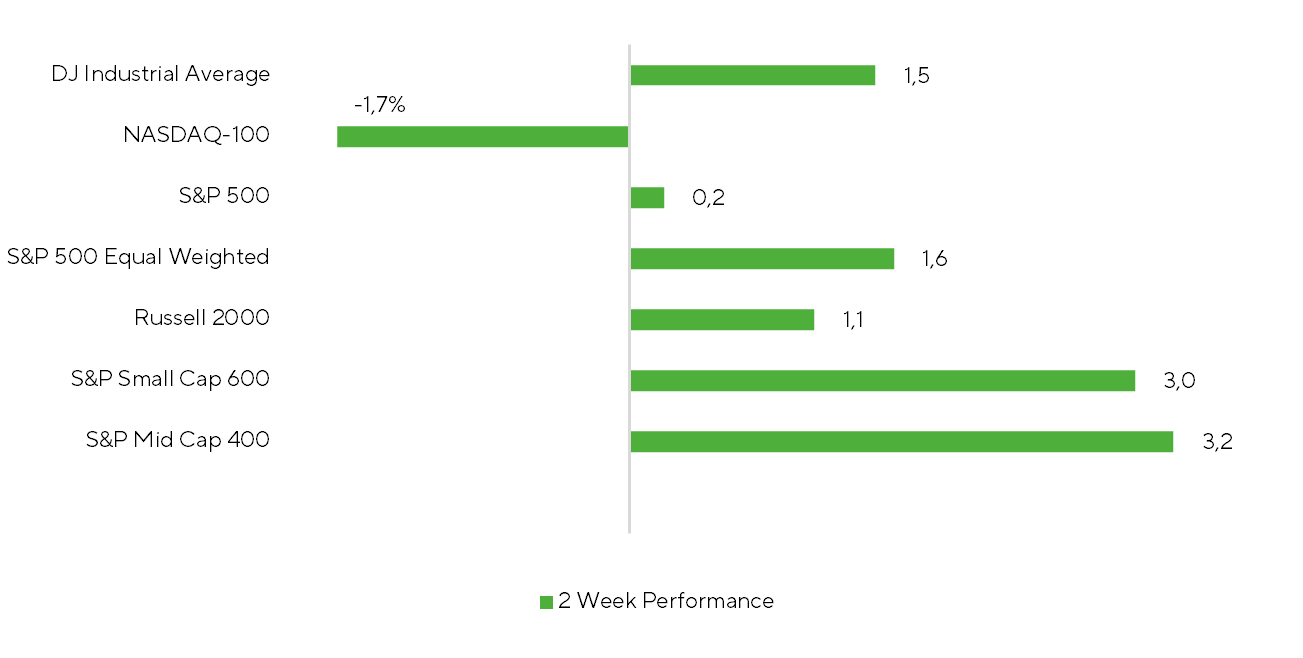
Source: FactSet, Freedom Broker
Market breadth showed a remarkable structural tilt. In the S&P 500, the breadth expanded from 56.5% in mid-January to 63.6% by early February, with investor attention rotating toward real-economy sectors—Energy, Materials, and Industrials. Simultaneously, in the tech-centered Nasdaq 100, the share of companies posting gains shrank to 46.1% from 53.9% over the same period, signaling deteriorating growth structure within the IT sector.
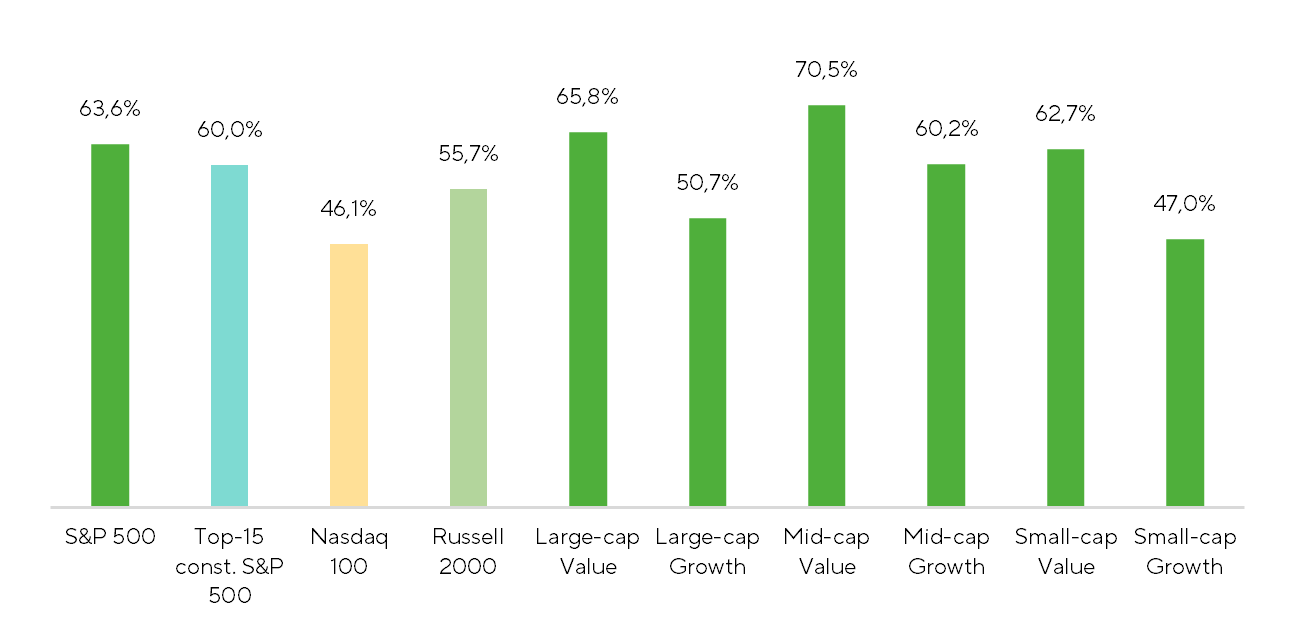
Market Breadth: Proportion of Companies Posting Gains
Sources: FactSet, Freedom Broker
An unusual black-swan-type shock in the metals segment added to market turbulence. On Friday, January 30, a prolonged rally in precious metals abruptly reversed. Gold suffered its sharpest intraday correction since 1980, and silver posted one of its deepest all-time declines. By the close of the main U.S. session, the gold-focused ETF (GLD) was down 10.3%, while the silver miners ETF (SIL) lost 28.5%. Having started in precious metals, the sell-off quickly spilled over into industrial metals. In effect, markets entered a global de-leveraging phase, where losses in one asset class forced position cuts across others. Spillover effects spread into the U.S. equity market, driving a pickup in volatility.
Market participants discussed the drivers of such an abrupt move. Some attributed the correction to the Kevin Warsh nomination as Fed Chair, citing his more hawkish stance and potential changes to the regulator’s operating framework. Others argued the sell-off was rather mechanical, driven by higher CME margin requirements on metals exposure, and by volatility clustering.
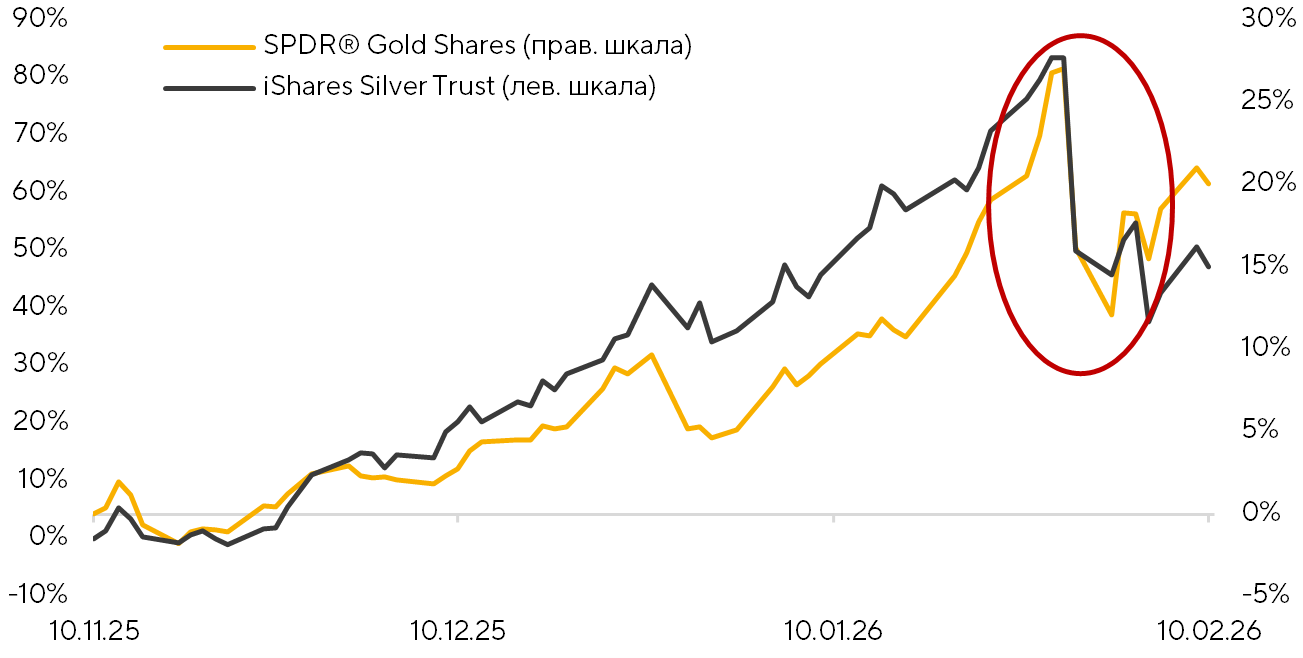
Gold vs. Silver: Normalized 3‑Month Returns
Source: FactSet, Freedom Broker
While originated in precious and industrial metals, the sell-off quickly spilled over into U.S. equities. As the metals complex stabilized, broader market volatility plateaued and began to ease; however, a cascade of headlines kept the IT sector under pressure, prolonging the correction.
Software was the epicenter of the decline as the risk of AI substitution shifted, in investors’ eyes, from theoretical to practical and structural following news around Anthropic’s tools. It is reasonable to view this not as a short-term correction, but as a market response to a fundamental transition—what might be termed the end of the workstation‑and‑screen era. Investors are increasingly recognizing that the SaaS model, which has powered the sector’s growth for decades, now comes under deflationary pressure from AI agents. Historically, revenue scaled with customer headcount—more employees meant more seats. The adoption of autonomous agents breaks that linkage, creating a risk of seat compression. If AI can do the work of several employees, firms may choose not to renew a portion of their licenses, leading to stagnation or declines in vendor revenue, even as the products remain in use.
In light of this, P/E multiples are compressing as the market prices in potential seat losses. The price impact was material: over two weeks, the iShares Expanded Tech-Software Sector ETF declined 13.9%. However, hardware largely avoided broad-based selling, with the iShares Semiconductor ETF up 2.8%. A sizable gap has opened between software and hardware, with the three-month performance differential now around 42%.
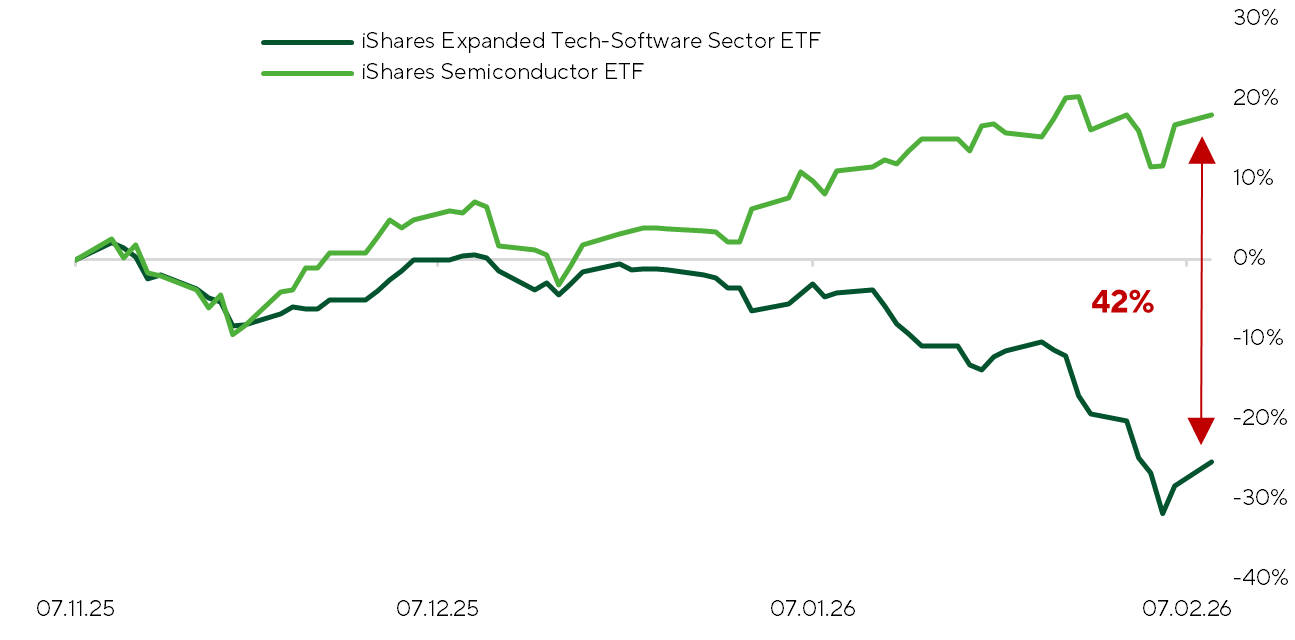
Hardware vs. Software: Normalized 3‑Month Returns
Source: FactSet, Freedom Broker
Macroeconomy. Over the past two weeks, investors were focused on the Fed’s policy decision. Following the January 27-28 meeting, the FOMC left the Fed Funds range unchanged at 3.50-3.75% p.a. This was widely anticipated; ahead of the meeting, the CME FedWatch Tool assigned less than a 4% probability to a rate cut. Two committee members voted for a 25bps cut: Stephen Miran, as has become customary, and Christopher Waller. The post-meeting statement offered little incremental information. It noted that economic activity continues to expand at a steady pace, job gains remain modest, and unemployment shows signs of stabilizing, while inflation remains elevated. One highlight of the press Q&A was Powell’s remark that the economy looks more sustainable than it did in December and continues surprising to the upside, with productivity playing a central role.
On the corporate side, attention has shifted to the unfolding Q4 2025 earnings season. Rising capex at mega-caps is unnerving investors; notably, Microsoft and Amazon shares sold off following their reports. For AMZN investors, the particularly painful surprise was the $200bn CAPEX program announced for 2026. Microsoft told a similar story: quarterly CAPEX of roughly $37.5bn—well above expectations—and management indicated spending will remain elevated in the near term.
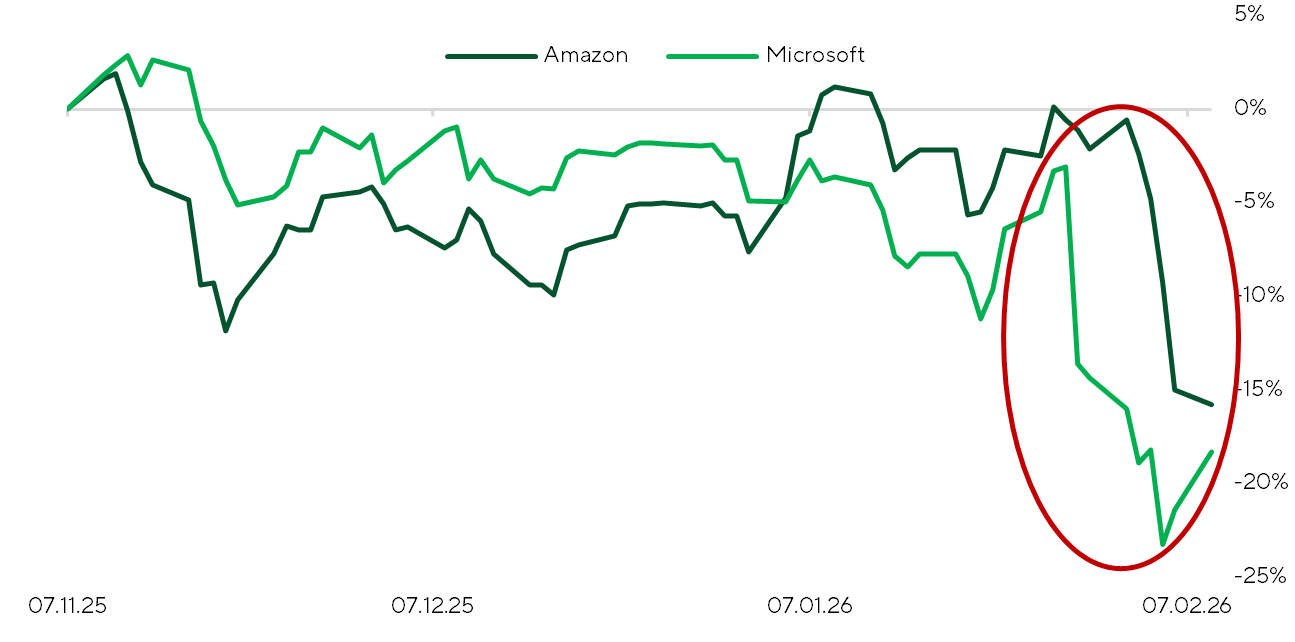
3-Month Normalized Returns: MSFT vs. AMZN
Source: FactSet, Freedom Broker
While the market remains cautious on rising mega-cap CapEx, earnings season continues to print decisively strong results. To date, ~61% of S&P 500 constituents (307 companies) have reported, with aggregate EPS growth running at 13.0% YoY, up from 9.5% just two weeks ago. Leadership remains concentrated in Information Technology, Industrials, and Communication Services, while Energy, Health Care, and Consumer Discretionary continue to lag. The tone is similarly constructive in small caps. Over 38% of S&P SmallCap 600 companies have reported, with aggregate EPS growth accelerating to 16.9% YoY, versus 14.4% previously.
Market Focus
Investor attention remains firmly anchored to geopolitics, particularly the evolving situation around Iran. The market continues to price in the “Iran factor,” injecting elevated uncertainty into the oil outlook. Energy equities are already reflecting a developing risk premium: the XLE ETF has rallied ~9.2% over the past two weeks. Notably, investors are adding exposure despite broadly soft quarterly prints. Consensus energy analysts continue to argue that, against a backdrop of global supply surplus, a meaningful portion of U.S. energy equities trade above fair value. However, contrarian voices are gaining traction, pointing to renewed interest in a potential commodity supercycle. On prediction markets, implied probabilities of a direct U.S.–Iran conflict stand at ~22% by end-February, ~41% by end-March, and ~55% by end-June. That said, ongoing negotiations have recently pushed those probabilities lower, tempering immediate escalation risk.
The macro calendar is relatively light, but one release stands out: the advance estimate of 4Q25 GDP, due February 20. We forecast +3.9% SAAR, slightly below the Atlanta Fed’s GDPNow estimate of +4.2%. Regardless of the modest gap, both point to a robust close to the year. We expect 4Q growth to come in decisively strong, proving resilient even amid the longest federal government shutdown of the quarter. By our estimates, the shutdown may have shaved roughly 1.5% off headline growth. We see the strong 4Q growth supported by low inflation, robust nominal consumer spending, and a net trade boost from declining imports alongside rising exports, aligning with the administration’s intended policy impact.
Investor focus remains on ongoing earnings season. Over the next week and a half, roughly 100 S&P 500 companies and 178 S&P SmallCap 600 issuers are set to report. Key market-watch names include Walmart (February 19) and Nvidia (February 25).
Walmart (WMT), the U.S. retail giant recently crossing $1tn market cap, has shown steady share-price performance, though consensus sees the stock near fair value.
Market sentiment remains moderately positive following a strong prior quarter. In 3Q25, revenue rose 5.8% YoY, with global eCommerce accelerating +27% YoY, and adjusted operating income up 8%. Walmart U.S. delivered comparable sales +4.5% YoY, with operating profits growing faster than revenue—evidence of the efficiency of its omnichannel model, advertising monetization, and marketplace expansion. For the current quarter, U.S. trends are expected to remain resilient, supported by eCommerce, advertising, and membership revenues, though international growth may be more volatile due to base effects (e.g., the Big Billion Days shift at Flipkart partially boosted 3Q results and may depress 4Q). Raised full-year guidance for revenue (4.8–5.1%) and adjusted operating income (4.8–5.5%) signals management’s confidence in demand resilience, though investors will monitor margin trends amid lingering inflationary pressures, rising operating costs, and the challenge of sustaining double-digit eCommerce growth. If guidance holds, the market may respond moderately positively, with FactSet consensus forecasting $130 over the next 12 months.
We remain decidedly bullish on Nvidia Corp. (NVDA) ahead of its upcoming earnings, anticipating another classic “beat & raise” across all core business segments. Strong results from the supply chain—including equipment vendors and contract fabs—combined with robust data-center CapEx growth, underscore sustained demand for AI accelerators. Rising chip output in absolute terms and accelerated inventory build across select electronics and automotive categories add further tailwinds. That said, expectations are extraordinarily high. Several major banks have already raised forecasts above management’s upper-end guidance, meaning a simple “beats consensus” may no longer be sufficient to drive sustained share gains. Investors will be closely watching margin trends amid memory tightness, commentary on AI-chip shipments to China (H200 upside potential), and early signs of competitive pressure from big-tech custom solutions. Any hint of softer guidance could be interpreted as share-loss risk, likely triggering elevated stock volatility. Our 12-month price target for NVDA is $250.
Broad Market Technical Analysis
S&P 500 staged a fresh rebound from the 7,000 zone in early February, with buyers stepping back in after the index tested the 100-day moving average near 6,800. That level continues to hold as a key support—the index hasn’t closed below it since May 2025. Momentum is firming: the RSI has climbed back above the 50 threshold, signaling room to run. Our base case remains a steady grind higher for the S&P 500, underpinned by broad-based participation. Currently, ~65–67% of constituents trade above their 200-day moving average, hovering near yearly highs — a healthy sign for the rally’s breadth. Risk-wise, only a decisive breach below 6,800 would shift the balance toward the downside.
Expected Trading Range
We expect the S&P 500 to trade in a 6,800–7,150 range.