Investment Review №339. Playing Defense

Vadim Merkulov
Head of Analytics department
Investment Idea: Electromed
LMD shares have a medium-term upside potential of more than 47%
About company
Electromed (ELMD) is a niche U.S. medical device company focused on airway clearance therapy, best known for its SmartVest High Frequency Chest Wall Oscillation (HFCWO) system. The investment case centers on a simple growth algorithm: expand the direct sales footprint, increase physician awareness and prescribing, and convert higher volume into disproportionate earnings growth through structurally high gross margins.
| Ticker | ELMD |
| Share price as of analysis | $24,41 |
| Target share price | $36 |
| Growth potential | 47,5% |
| Share price dynamics vs. indices | Day | Week | Month | Quarter | Year |
| ELMD | 0,6% | 0,6% | (14,6%) | (5,8%) | (12,7%) |
| S&P 500 | (1,0%) | 0,0% | (1,1%) | 3,6% | 13,7% |
| Russell 2000 | (1,6%) | (1,0%) | (1,8%) | 10,6% | 19,4% |
| DJ Industrial Average | (1,7%) | (1,4%) | (0,6%) | 5,5% | 12,4% |
| NASDAQ Composite Index | (1,1%) | 0,4% | (3,7%) | 1,6% | 15,9% |
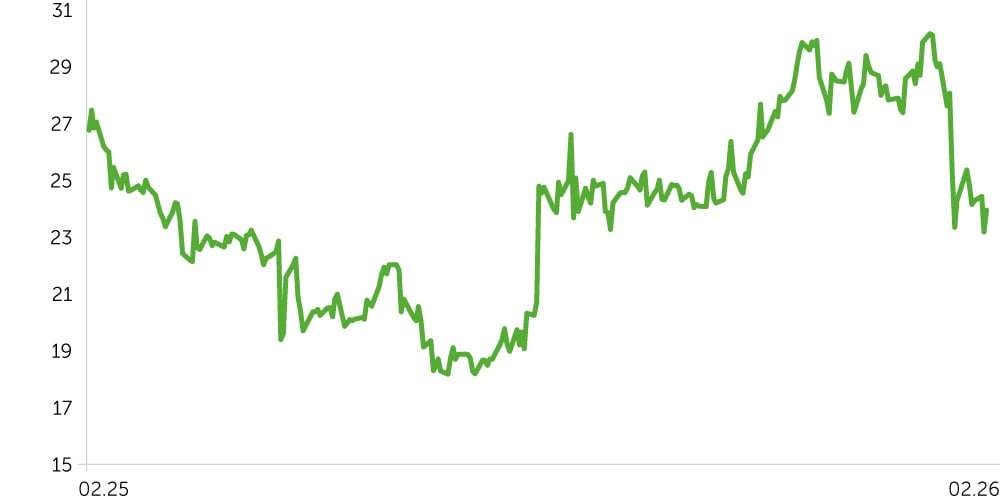
Price dynamics ELMD, $
Key Investment Theses
End market fundamentals remain supportive. We view the U.S. HFCWO market as structurally growing on three reinforcing trends: rising prevalence of chronic respiratory diseases, improving diagnosis rates as high resolution CT use expands, and a broader shift toward home based care. RespirTech estimates U.S. bronchiectasis prevalence is increasing at roughly 10% annually, which implies a steadily expanding diagnosed pool and rising clinical and economic burden that supports adoption of therapies with the potential to reduce exacerbations, hospital admissions, and antibiotic use.
Electromed’s direct to patient commercial model is designed to reduce friction in a reimbursement mediated workflow. Physicians prescribe SmartVest primarily for bronchiectasis, but also for cystic fibrosis, COPD, and select neuromuscular disorders, with older bronchiectasis patients representing the core target population. Electromed then coordinates directly with patients and payers to secure reimbursement, deliver the device, and provide training and ongoing support, which creates a controlled path from prescription to shipment and positions the company to defend pricing and service quality versus more intermediary heavy models.
Near term execution catalysts are strengthening throughput and expanding access. Management is scaling the direct sales force to 61 representatives by FY26 year end, and Q2’26 demonstrated productivity above target, with annualized revenue per rep at $1.2 million on 58 average reps versus a $1.0 million to $1.1 million target range, even as management expects normalization as new hires ramp. Process upgrades are incremental catalysts: CRM now unifies sales and reimbursement teams in a single system, improving order visibility and reducing back and forth, while ePrescribe reduces documentation errors and increases confidence in reimbursement readiness, which can accelerate shipment timing. On payer access, 25 new contracts added 2.9 million covered lives in the first half, bringing total coverage to roughly 85% of addressable U.S. covered lives and reducing “out of network” leakage in specific geographies.
Q2’26 financial results reinforce the operating leverage profile. Total revenue increased 16.3% y/y to $18.9 million, driven by home care revenue up 18.4% y/y to $17.3 million, while gross margin remained anchored in the high 70s and operating leverage continued to build. Seasonality should drive a sequential step down from Q2 to Q3, but we still expect double-digit growth as the core home care engine remains intact
We estimate a 12-month upside potential of approximately 47.5% for ELMD shares with our fair value anchor based on a 15x forward EV/EBITDA multiple, in line with historical sector averages. Our target price is $36 with a recommendation. As a risk-management level, we suggest considering a stop loss at $18.
| Ratio Analysis | 2023A | 2024A | 2025A | 2026E | 2027E | 2028E | 2029E | 2030E |
| ROE | 8% | 12% | 17% | 18% | 16% | 15% | 12% | 13% |
| ROA | 7% | 10% | 14% | 15% | 14% | 13% | 11% | 11% |
| ROCE | 11% | 15% | 22% | 23% | 22% | 19% | 17% | 16% |
| Sales/Assets (x) | 1,05x | 1,05x | 1,19x | 1,15x | 1,01x | 0,88x | 0,81x | 0,74x |
| P/E (x) | 29,81x | 25,91x | 29,30x | 22,22x | 19,01x | 16,23x | 15,97x | 12,74x |
| Margins, % | 2023A | 2024A | 2025A | 2026E | 2027E | 2028E | 2029E | 2030E |
| Gross Margin | 76% | 76% | 78% | 78% | 80% | 78% | 79% | 80% |
| EBITDA Margin | 8% | 12% | 15% | 17% | 19% | 19% | 19% | 20% |
| Net Margin | 7% | 9% | 12% | 13% | 14% | 15% | 14% | 16% |
| Financials, $mln | 2023A | 2024A | 2025A | 2026E | 2027E | 2028E | 2029E | 2030E |
| Revenue | 48 | 55 | 64 | 72 | 81 | 88 | 99 | 109 |
| COGS | 12 | 13 | 14 | 16 | 16 | 19 | 21 | 22 |
| Gross Income | 37 | 42 | 50 | 57 | 65 | 69 | 78 | 87 |
| G&A | 32 | 34 | 39 | 43 | 48 | 52 | 58 | 64 |
| R&D | 1 | 1 | 1 | 1 | 1 | 1 | 1 | 1 |
| EBITDA (adj.) | 4 | 7 | 10 | 12 | 16 | 17 | 19 | 22 |
| Interest expense (income) | 0 | 0 | 1 | 0 | 0 | 0 | 0 | 0 |
| Pretax Income | 4 | 7 | 10 | 13 | 16 | 17 | 19 | 22 |
| Income Taxes Paid | 1 | 2 | 3 | 3 | 5 | 4 | 6 | 5 |
| Net Income | 3 | 5 | 8 | 10 | 11 | 13 | 13 | 17 |
| Dilluted EPS | $0,36 | $0,58 | $0,85 | $1,11 | $1,30 | $1,53 | $1,55 | $1,94 |