
Investment Review №342. A Delicate Balance

Vadim Merkulov
Head of Analytics department
Photronics. Three Ingredients for Success
ERO shares are attractive for purchase with a target price of $36 per share.
About company
Photronics (PLAB) is a global leader in manufacturing photomasks, the essential templates used to produce integrated circuits and flat panel displays. Operating as a key independent (merchant) supplier, the company captures sustained demand across both advanced and legacy semiconductor nodes. Photronics’ strategic manufacturing presence in major Asian technology hubs ensures deep integration with clients, enabling robust operational resilience, strong margins, and stable cash flow generation despite broader semiconductor industry cyclicality.
| Ticker | PLAB |
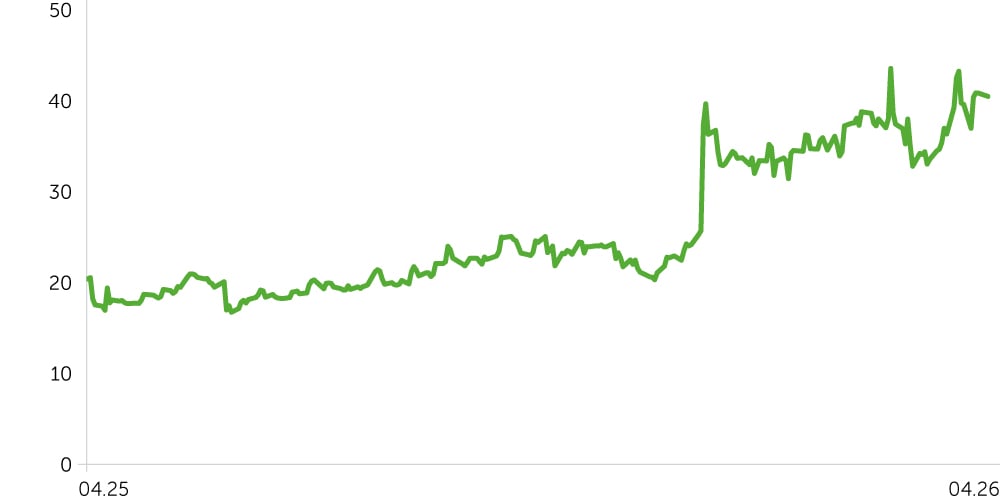
| Share price as of analysis | $40,49 |
| Target share price | $49 |
| Growth potential | 21% |
| Share price dynamics vs. indices | Day | Week | Month | Quarter | Year |
| PLAB | (0,9%) | 9,5% | 23,4% | 15,0% | 131,2% |
| S&P 500 | 0,4% | 4,2% | (1,9%) | (4,8%) | 30,3% |
| Russell 2000 | 0,4% | 5,2% | 0,6% | (1,6%) | 39,1% |
| DJ Industrial Average | 0,4% | 3,2% | (1,8%) | (5,6%) | 21,8% |
| NASDAQ Composite Index | 0,5% | 5,8% | (1,7%) | (6,6%) | 41,1% |
Price dynamics PLAB, $
Investment Thesis
Essential role in manufacturing and design-driven growth. Photomasks are an indispensable component of semiconductor manufacturing, meaning they are required regardless of broader market cycles. Crucially, demand for PLAB’s products is driven by the introduction of new chip designs rather than overall chip production volumes. As the pace of global technological innovation accelerates, the sheer number of new semiconductor designs is rapidly increasing. Furthermore, the industry's continuous transition to smaller, more complex semiconductor nodes requires a significantly higher number of photomasks per chip set, creating a powerful structural tailwind for the company’s long-term sales volume.
Key beneficiary of the shift from in-house to independent suppliers. The photomask market is undergoing a structural transformation. Currently, internal (in-house) producers hold about 60% of the market, while independent merchant suppliers account for the remaining 40%. To optimize massive R&D and capital costs, in-house producers are increasingly focusing their internal resources exclusively on ultra-advanced, cutting-edge nodes (e.g., sub-7nm), actively outsourcing the production of mature nodes (28nm and above) to independent suppliers. Holding approximately a 30% share within the merchant segment, Photronics is perfectly positioned to absorb this outsourced volume, as it already possesses the optimized equipment and scale for these higher nodes.
Strategic CapEx cycle to capture advanced-mid node capacity. To capitalize on these industry shifts and secure future growth, management has outlined a substantial capital expenditure plan, guiding for $330 million in CapEx for 2026. These investments will be strategically directed toward renewing current manufacturing equipment and expanding production capacity to manufacture photomasks for smaller, high-value nodes (e.g., 14nm to 22nm). As in-house manufacturers continue to abandon these mid-tier nodes to focus solely on the bleeding edge, PLAB’s upgraded technological footprint will allow it to capture this newly outsourced, higher-margin volume, ensuring sustainable profitability and market share expansion.
We set a target price for PLAB at $49 with a “Buy” recommendation. A stop-loss is advised at the $34 level.
| Ratio Analysis | 2023A | 2024A | 2025A | 2026E | 2027E | 2028E | 2029E | 2030E |
| ROE | 14% | 12% | 12% | 11% | 10% | 10% | 10% | 9% |
| ROA | 9% | 8% | 8% | 7% | 7% | 7% | 6% | 6% |
| ROCE | 19% | 14% | 13% | 11% | 11% | 11% | 11% | 10% |
| Sales/Assets (x) | 0,63% | 0,54x | 0,48x | 0,46x | 0,44x | 0,42x | 0,40x | 0,38x |
| Margins, % | 2023A | 2024A | 2025A | 2026E | 2027E | 2028E | 2029E | 2030E |
| Gross Margin | 38% | 36% | 35% | 35% | 36% | 36% | 36% | 37% |
| EBITDA Margin | 37% | 35% | 34% | 34% | 38% | 38% | 38% | 38% |
| Net Margin | 22% | 21% | 22% | 22% | 21% | 21% | 22% | 22% |
| Financials, $mln | 2023A | 2024A | 2025A | 2026E | 2027E | 2028E | 2029E | 2030E |
| Revenue | 892 | 867 | 849 | 884 | 934 | 996 | 1 052 | 1 100 |
| Major expenses | -556 | -551 | -549 | -578 | -602 | -641 | -671 | -697 |
| Gross profit | 336 | 316 | 300 | 306 | 332 | 355 | 380 | 404 |
| SG&A | -83 | -94 | -92 | -96 | -101 | -107 | -113 | -119 |
| EBITDA | 334 | 304 | 286 | 305 | 352 | 374 | 397 | 419 |
| Depreciation | 81 | 83 | 78 | 94 | 121 | 126 | 131 | 134 |
| Interest payments (income) | 17 | 26 | 14 | 35 | 21 | 21 | 22 | 22 |
| Pre-tax profit | 270 | 247 | 222 | 246 | 252 | 269 | 289 | 307 |
| Tax | -70 | -64 | -32 | -50 | -53 | -57 | -61 | -64 |
| Net Income | 200 | 184 | 190 | 195 | 199 | 213 | 228 | 242 |
| Earnings per share (diluted, adjusted) | $2,04 | $2,05 | $2,01 | $2,29 | $2,45 | $2,57 | $2,76 | $2,93 |