Investment Review №344. A Commitment to Techno-Optimism
Market Environment as of May 4
Global View
Over the past two weeks, U.S. equity market performance was uneven, with market breadth narrowing materially. The S&P 500 gained 1.3%, while its equal-weighted counterpart declined 1.1%. The Dow Jones Industrial Average also came under pressure, falling 1.0%, pointing to continued capital rotation out of parts of the blue-chip complex. The NASDAQ-100 was the clear outperformer, advancing 4.0%, while small caps traded largely sideways: the Russell 2000 edged up 0.2%, and the S&P SmallCap 600 finished the period broadly flat.
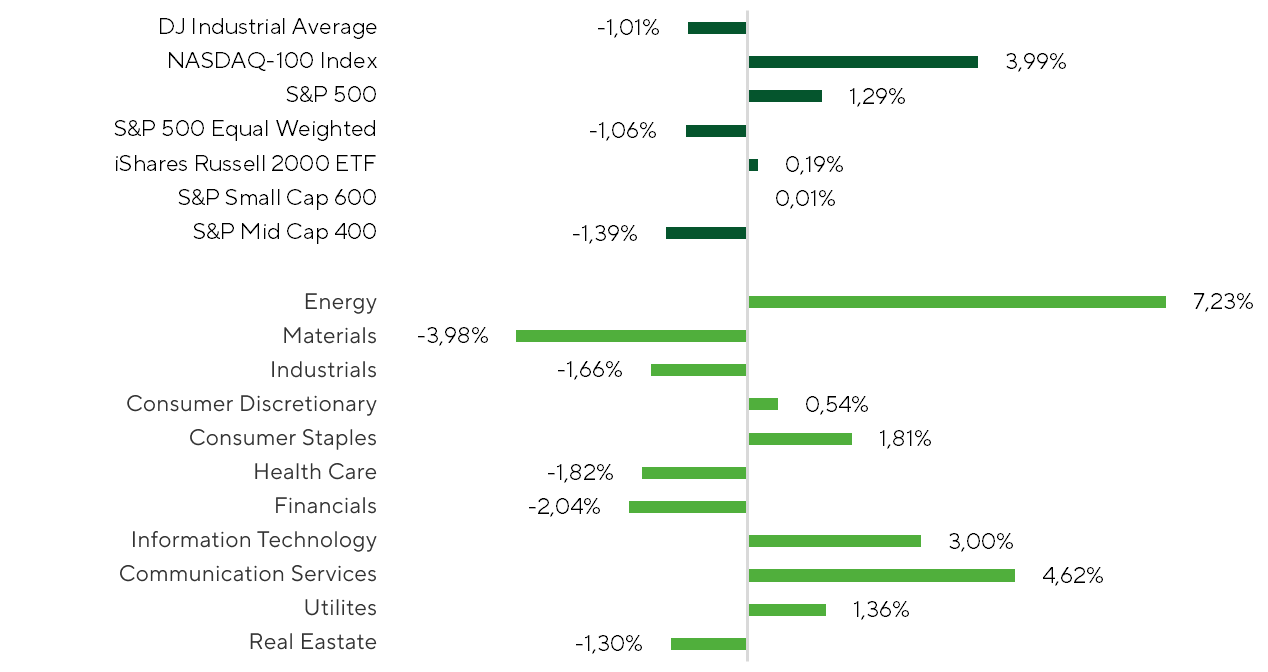
Index and Sector Performance Over the Review Period
Source: FactSet, Freedom Broker analysis
Market breadth increasingly signaled a narrowing rally, with gains concentrated in select sectors and investment narratives.
Despite the advance in the S&P 500, only 36.8% of index constituents posted positive returns over the period. A similar pattern emerged in the NASDAQ: despite strong index-level performance, just 49.0% of constituents finished in positive territory.
At the sector level, gains were similarly concentrated. Only three sectors posted broad-based rallies: Energy, Utilities, and Information Technology. Within the Energy ETF (XLE), ~92% of constituents delivered positive returns, while the median stock gain reached 8.9%.
The key driver of the Energy sector was the rally in oil prices, with Brent moving into the $110–115/bbl range. Prices were supported by persistent geopolitical uncertainty, which continued to embed a higher risk premium into crude markets. An additional tailwind came from record-high U.S. exports of crude and refined products. The industry benefited from reduced export flows through the Strait of Hormuz. Weekly data as of May 1 showed net U.S. petroleum product exports rising to a record 6.5m bpd. The U.S. has also increased crude releases from strategic reserves, though only 23m bbl of the 172m bbl coordinated with the IEA have been deployed so far. Against this backdrop, elevated U.S. exports of oil and refined products are likely to persist in the coming weeks.
Other sectors where more than 50% of constituents posted positive returns were Utilities and Information Technology. Both segments were underpinned by a common narrative—AI infrastructure buildout. Utilities were increasingly viewed as beneficiaries of rising power demand from data centers, while in IT, investor focus shifted back toward semiconductors and equipment suppliers tied to the ongoing expansion of compute capacity.
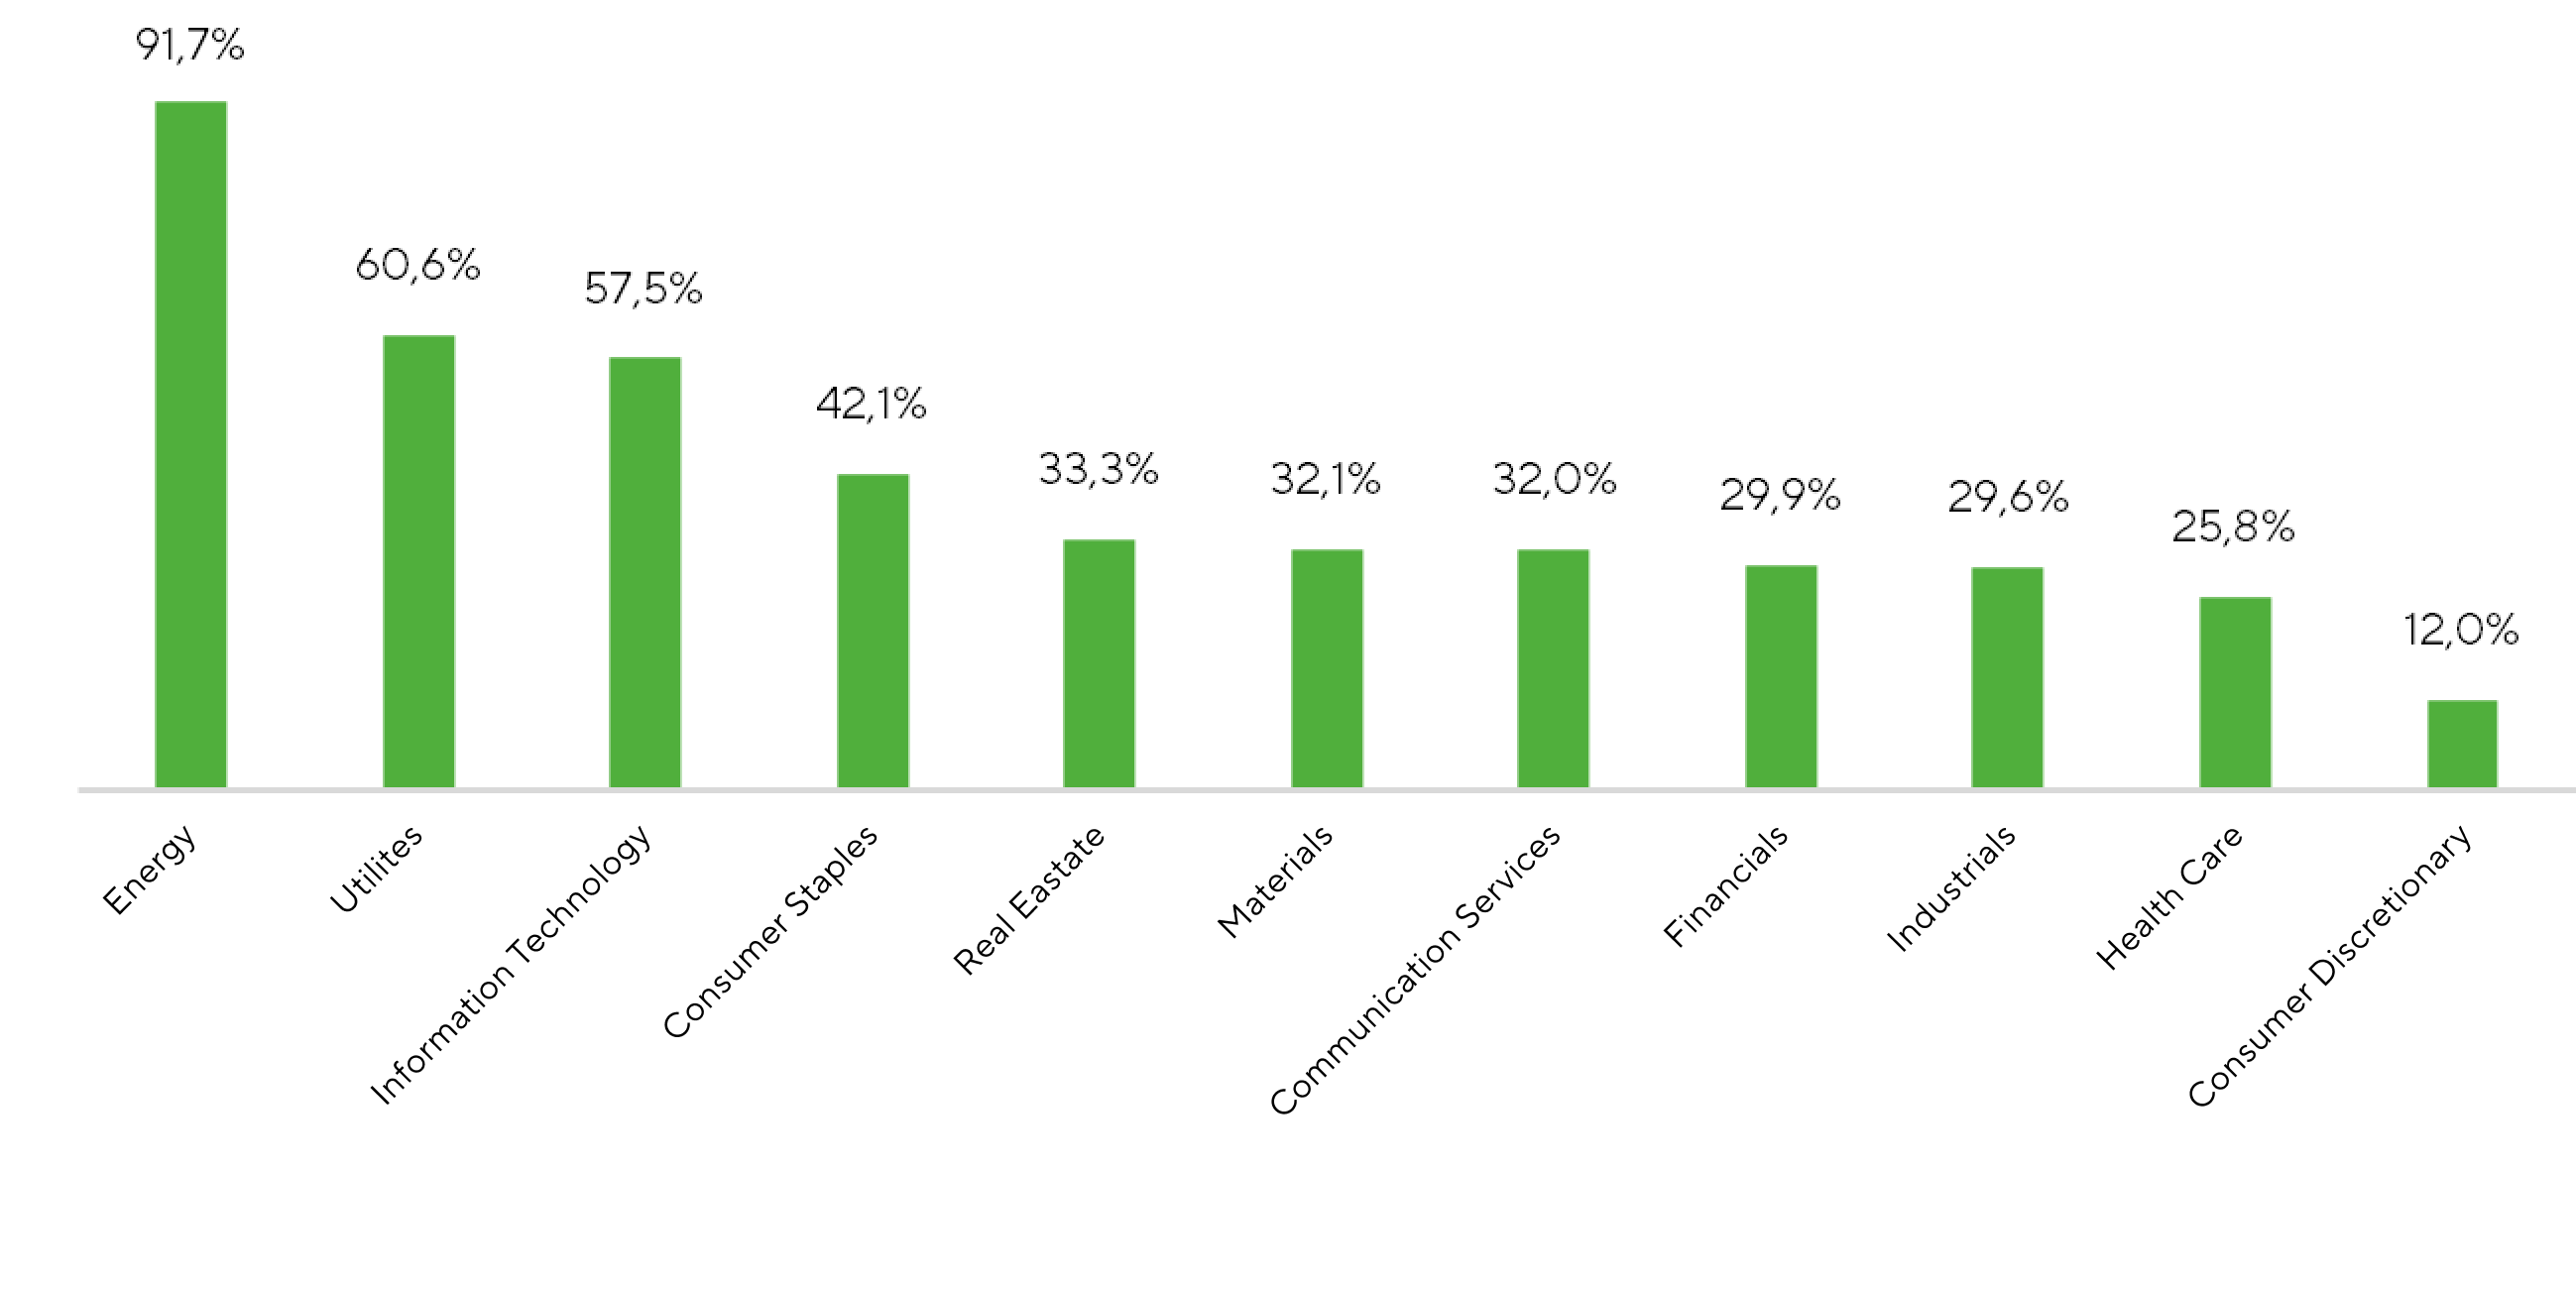
Share of S&P 500 Companies with Positive Returns by Sector Over the Review Period
Source: FactSet, Freedom Broker analysis
A further driver of NASDAQ-100 outperformance was the earnings season among mega-cap technology names. Alphabet, Microsoft, Amazon, and Meta broadly delivered strong operating results, reinforcing investor focus on sustained demand for cloud services, AI infrastructure, and digital advertising. However, market reactions remained uneven at the stock level, with investors increasingly differentiating not only on headline beats, but also on management commentary, CapEx intensity, and the durability of forward growth trajectories.
Semiconductors already saw pronounced support, with the SOXX ETF rising 10.7%. This reflects sustained investor interest in chipmakers, memory producers, and data center equipment suppliers, which remain among the key beneficiaries of the AI-driven investment cycle.
The fundamental underpinning of the semiconductor rally has been a sharp acceleration in capital expenditure from leading technology firms. Combined CapEx from Microsoft, Amazon, Alphabet, and Meta rose from $217bn in 2024 to $357bn in 2025. Looking ahead, consensus projections point to a further step-up to $629bn in 2026, followed by $776bn in 2027 and $799bn in 2028. This scale of investment into data centers, cloud capacity, and AI infrastructure is establishing a structurally elevated demand base for semiconductors and adjacent ecosystem segments.
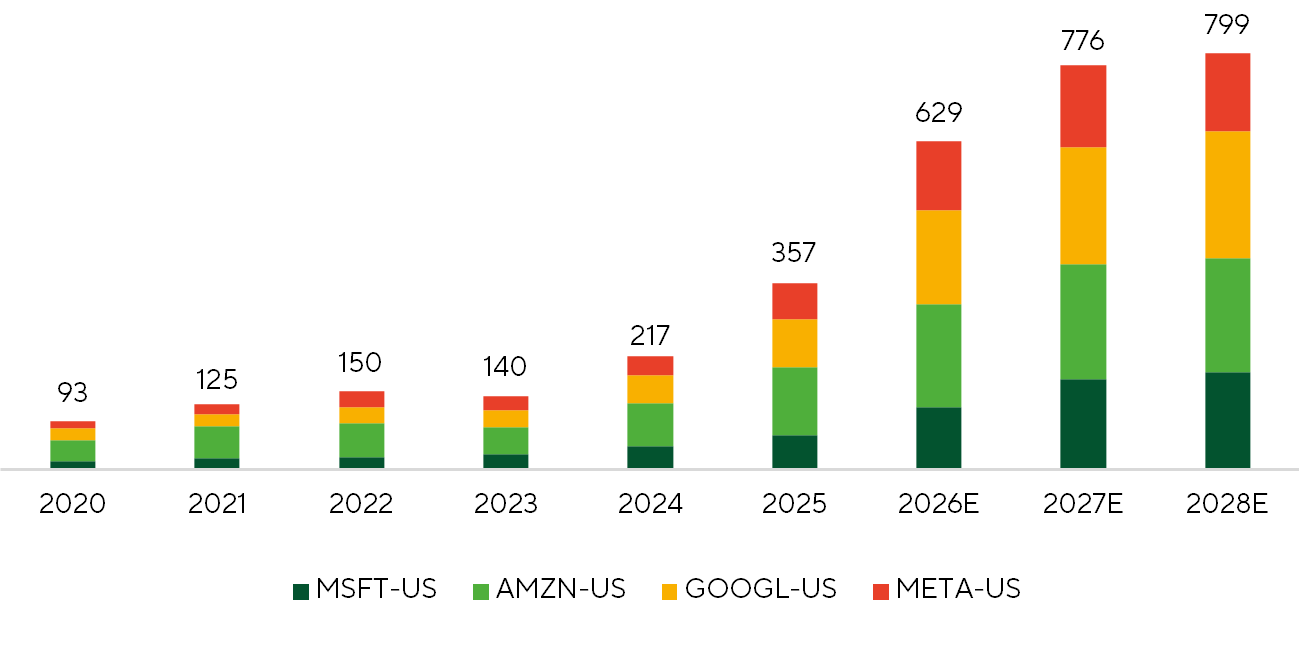
CapEx, $bn
Source: FactSet, analysis Freedom Broker
Beyond the megacaps, more than 80% of S&P 500 companies have already reported quarterly results, with earnings broadly reinforcing the narrative of a resilient corporate sector. Aggregate EPS growth among reporting companies reached 27.5% YoY, while roughly 85% exceeded Wall Street expectations.
Among the key macro developments of the past two weeks, the April meeting of the Federal Reserve and the first estimate of U.S. 1Q26 GDP stood out. As widely expected, the Fed kept the federal funds target range unchanged at 3.50–3.75%, though the tone of the statement shifted materially more hawkish. First, the Fed revised its characterization of inflation from “somewhat elevated” to simply “elevated.” According to Jerome Powell, higher energy prices only partially explained the change in wording. Second, three regional Fed presidents— Beth Hammack, Lorie Logan, and Neel Kashkari—opposed retaining language in the statement that implicitly pointed toward further easing. The debate centered on the phrase: “in considering the extent and timing of additional adjustments to the target range for the federal funds rate.” Their position was that the word “additional” should be removed, shifting the communication framework away from an easing bias toward a more symmetrical stance, where a rate hike would be viewed as just as plausible as a cut. That shift was immediately reflected in futures pricing, with the CME FedWatch tool beginning to imply a small probability of rate hikes in 2026–2027, replacing the previously implied probability of additional easing. An important political and institutional signal also came from Powell’s statement that, following the end of his term as Fed Chair on May 15, he intends to remain on the Board of Governors but will not serve as a “shadow chair.” Powell cited ongoing attacks on Fed independence and the need to await completion of the Department of Justice investigation into cost overruns tied to the Fed’s building renovation projects. Because Powell’s term as a governor runs through 2028, the decision delays the ability of the Donald Trump administration to appoint another supporter of a more dovish policy stance.
The advance estimate of U.S. 1Q26 GDP, released on April 30, showed the economy expanding at a 2.0% QoQ annualized pace. Consensus expectations had called for 2.2% growth, while our nowcast model pointed to 1.7% and the Federal Reserve Bank of Atlanta GDPNow model to 1.2%. Overall, the release came in broadly in line with expectations. The main upside surprise came from stronger consumer spending, supported by upward revisions to March goods consumption data, as well as a smaller-than-expected increase in government spending. Another positive surprise was non-residential fixed investment, which rose 10.4% annualized, versus expectations in the 5–7% range. The largest contribution came from equipment investment, up 17.2%, and intellectual property products investment, which increased 13.0%. Both categories accelerated sharply following a weak 4Q25, when growth stood at 4.3% and 5.4%, respectively. More broadly, the investment cycle that began in 1Q25 remains intact. Since then, equipment investment has averaged annualized growth of 11.3%, while intellectual property investment has averaged 9.1%.
Market Focus
Over the next two weeks, market attention is likely to center on three themes: developments in U.S.-Iran negotiations and the situation around the Strait of Hormuz, the remaining 1Q earnings releases, and April inflation data.
The situation around Hormuz remains highly uncertain. Reports of progress in aligning U.S. and Iranian negotiating positions pushed WTI below $100/bbl in recent sessions. We remain skeptical about the prospects for a durable peace agreement. Military structures affiliated with the Islamic Revolutionary Guard Corps continue to wield substantial influence in Iran, complicating Tehran’s ability to fully accept White House conditions. At the same time, the U.S. blockade is placing significant pressure on the Iranian economy, meaning a temporary reopening of the Strait by both sides as a basis for continued negotiations cannot be ruled out. On the corporate front, investor focus will shift toward the remaining 1Q earnings releases. Among the most closely watched reports, we highlight The Mosaic Company on May 11 and NVIDIA on May 20.
The Mosaic Company is scheduled to report first-quarter 2026 results on May 11. The setup appears more favorable across fertilizers, particularly in phosphates, where prices are supported by Chinese export restrictions and steady global demand. The key swing factor will be a recovery in operating performance after a weak 4Q. The company is gradually normalizing its phosphate production, which should support margins and strengthen cash generation; an incremental positive could come from working-capital release as excess inventories are reduced. The principal risk remains elevated sulfur prices, which continue to pressure margins in the company’s phosphate segment and Brazilian operations. Overall, the print could signal that Mosaic has passed a local earnings trough and is entering an operational recovery. Investor interest in the company may also be supported by ongoing tensions in the Strait of Hormuz, which are constraining supply chains for key fertilizer inputs. According to FactSet’s consensus, the 12-month price target for MOS is $28.70.
On May 20, Nvidia will release its Q1 FY27 earnings. Heading into the print, market expectations sit at or above the upper end of management’s guidance, fueled by commentary from other semiconductor and technology companies on AI infrastructure investments. While all hyperscalers have directly or indirectly signaled higher capex plans, a meaningful portion of the increase reflects component cost inflation—most notably in memory and CPUs. The narrative that Nvidia is gradually ceding share in the AI accelerator market has gained traction in recent quarters. At the same time, Nvidia’s own guidance raises have had only a muted effect on sentiment. In our view, the market’s reaction to the upcoming report will hinge on three factors: progress in monetizing Nvidia’s Vera CPU portfolio, the pace of monetizing new Groq LPUs, and any changes in the capital-return framework, including dividends and buybacks. We remain constructive and believe the market underestimates the potential of these factors. Nvidia’s continued investment across its vendor ecosystem suggests increasing demand visibility and the company’s intent to secure scarce semiconductor capacity in advance. Our 12 month fair price target for NVDA is $250.
Regarding the macroeconomic calendar, the market is awaiting the April CPI release (May 12). We forecast headline CPI at 0.32% MoM, or 3.45% YoY. We expect the fuel component to rise 1.6% MoM in April amid the ongoing tensions around the Strait of Hormuz. We also project a moderate increase of 0.16–0.18% MoM in food and other basic goods, while core CPI is predicted at 0.25% MoM,[OS1.1] with probable rounding down to approximately 0.248%. On an annual basis, this is consistent with a 2.6% YoY forecast. Within services, we expect prices to increase 0.27% MoM, with transportation services showing the most notable gain at 0.52% MoM according to our model. So far, we do not see any material risks of a sustained reacceleration in inflation. A modest pickup in prices for basic goods and transportation services is possible in April–May, but we estimate the impact on core inflation will not exceed 0.1 pp MoM. Consensus places the CPI headline at 3.9% YoY, which is above our estimates.
Technical Broad-Market Analysis
The S&P 500 extended its impulsive uptrend, reaching a new all-time high. It is trading well above its 20-, 50-, and 200-day moving averages, signaling strong upside momentum. However, the RSI has climbed to 75—the highest since July 2025—indicating the market is overbought in the near term. Our base case calls for a brief consolidation following the recent surge. Key support is located at 7,050 and 7,175. The primary target remains around 7,400; if that level is breached, the next resistance is the psychological 7,500 mark. A meaningful deterioration in the technical setup would only be signaled by a move back below 7,000. Pullbacks toward that region would likely represent a healthy pause within the prevailing trend. Separately, the equal-weighted S&P 500 is merely testing its all-time high and has yet to deliver a convincing breakout, continuing to lag the cap-weighted benchmark. Other metrics also point to a narrow rally: only about 55% of constituents are trading above their 50-day moving averages, even as the market has detached from this moving average by a substantial 7.5%.
Expected Trading Range
The S&P 500 is likely to trade within the 7,150–7,500 range.