
Investment Review №345. Treasuries vs Stocks
Market Environment as of May 18
Global View
Over the review period, U.S. equities extended their advance, though market breadth remained uneven. The S&P 500 rose 2.8%, while the NASDAQ-100 outperformed with a 4.9% gain. The Dow Jones Industrial Average added 1.5%, whereas the equal-weighted S&P 500 advanced only 0.6%. Mid- and small-cap segments lagged: S&P Mid Cap 400 declined 0.3%, Russell 2000 ETF fell 0.7%, and S&P Small Cap 600 dropped 1.3%. At the sector level, Information Technology remained the clear leader, rising 7.4%, supported by expectations of continued AI infrastructure investment, strong semiconductor demand, and a rebound in cybersecurity and software names.
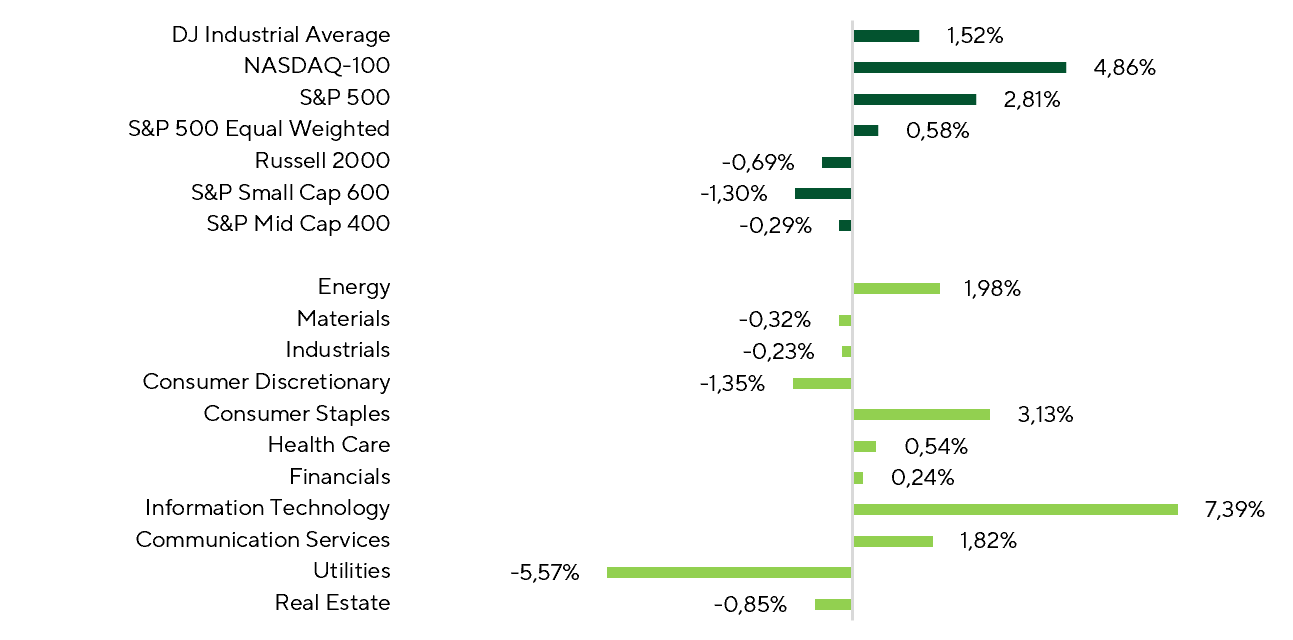
Index and Sector Returns Over the Period.
Source: FactSet, Freedom Broker analysis
Market breadth improved somewhat versus the prior period, but a broad-based rally is still absent. Indices continue to test new all-time highs, yet gains remain concentrated in the largest IT names, supported by a single dominant narrative—AI. The share of S&P 500 constituents with positive returns stood at 47.1%, while in the NASDAQ-100 the figure reached 57.8%. The divergence between the broader market and the largest index components remains particularly pronounced: among the top 15 S&P 500 companies, 86.7% posted positive returns, reinforcing the view of a narrow, concentrated advance.
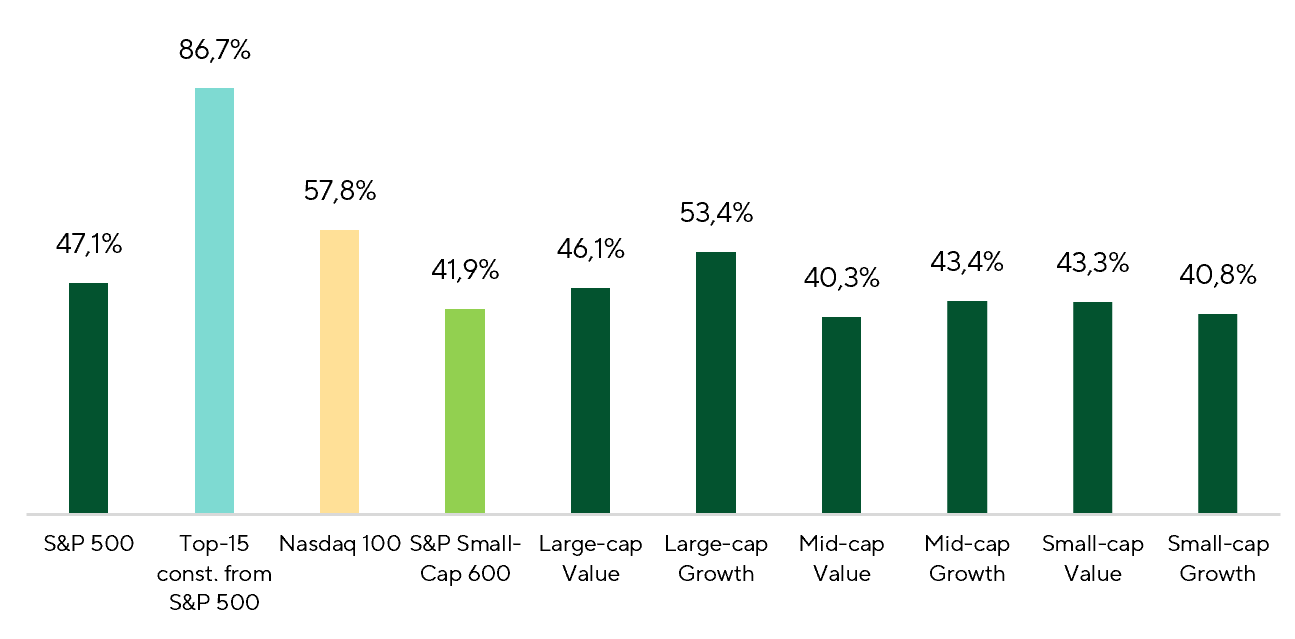
Share of Companies with Positive Performance Across Indices Over the Period.
Source: FactSet, Freedom Broker analysis
Within IT, the cybersecurity segment outperformed notably over the review period. The First Trust NASDAQ Cybersecurity ETF (CIBR) advanced 16%, while its largest holdings posted even stronger moves: Akamai Technologies (AKAM: 42,5%), Datadog (DDOG: +42,4%), Fortinet (FTNT: +41,8%), Palo Alto Networks (PANW: +34,1%), CrowdStrike (CRWD: 31,9%), and Cisco (CSCO: +28,3%). The move largely reflected a rebound from prior pressure on the sector tied to concerns around Anthropic Mythos—an advanced AI model capable of accelerating vulnerability discovery and potentially reshaping the economics of traditional cybersecurity solutions. However, as expected, the market began to reframe the development of such AI systems as a demand catalyst for cybersecurity solutions: the faster AI infrastructure and automation evolve, the higher the potential risks to corporate networks, cloud environments, and data, and therefore the greater the need for defensive infrastructure. Additional support came from strong corporate results. Fortinet delivered a significantly better-than-expected quarterly report, with an EPS surprise of ~32%, marking one of the strongest results in the sector this earnings season. Akamai Technologies also contributed meaningfully to ETF performance, announcing a large long-term cloud contract with a frontier AI model developer, with market speculation suggesting a possible link to Anthropic. The deal reinforced Akamai Technologies’ positioning as a potential beneficiary of AI infrastructure growth and rising demand for distributed computing capacity.
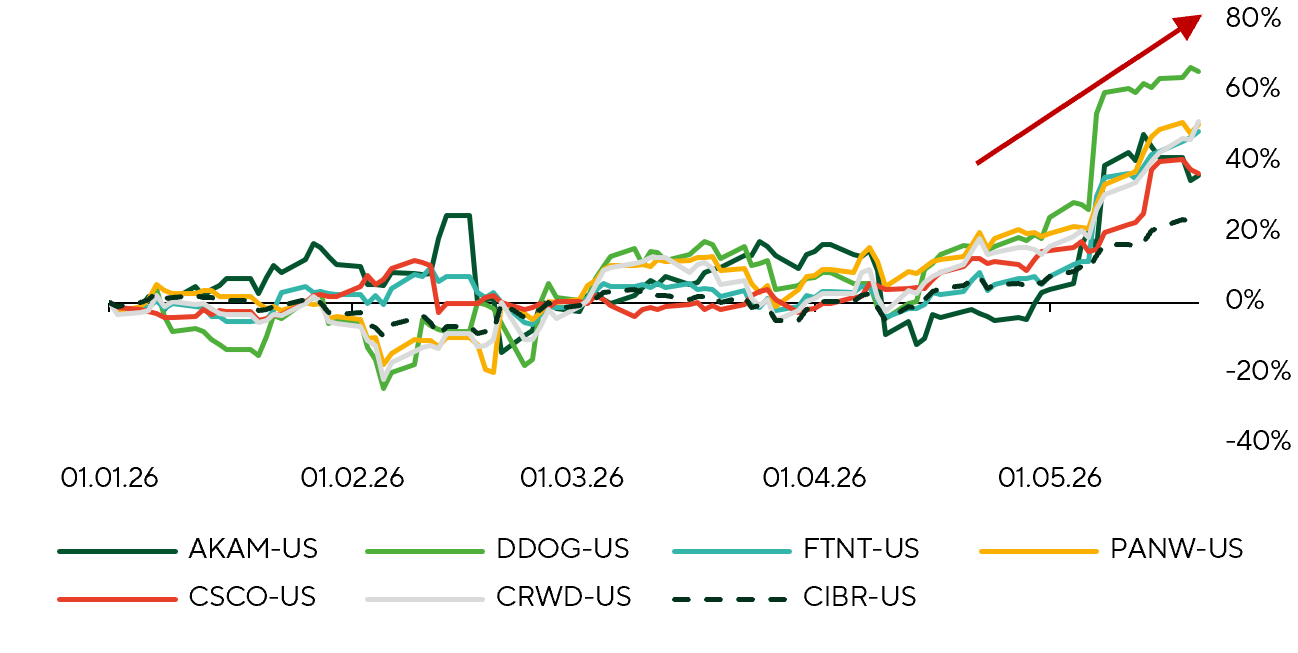
Returns of the CIBR ETF and Its Constituent Companies.
Source: FactSet, Freedom Broker analysis
On the other side of the ledger, Utilities were the main laggard of the period, with the sector declining 5.6%. This marked a sharp reversal from the prior period, when Utilities were supported by expectations of rising electricity demand from data centers and AI infrastructure. Only 9.1% of Utilities companies ended the period in positive territory. The main pressure driver was likely the rise in U.S. Treasury yields, as Utilities are traditionally rate-sensitive due to their high capital intensity, elevated leverage, and direct competition between dividend yields and bond yields.
Turning to the dynamics of government bond yields, market participants began to price in the “higher-for-longer cost of capital” narrative. The rise in Treasury yields across the curve reflects several factors: hotter-than-expected April inflation prints that shifted long-term inflation expectations higher, elevated energy prices, more cautious Fed commentary, weak Treasury auction demand, and concerns that fiscal measures aimed at cushioning the gasoline shock could deteriorate the budget outlook. Since the start of the year, long-end Treasury yields have increased by ~50bps, with 10Y yields rising by ~40bps and 30Y yields advancing by ~32bps. Against this backdrop, markets are increasingly debating how attractive certain equity segments remain when long-term Treasury yields are approaching the 5% level.
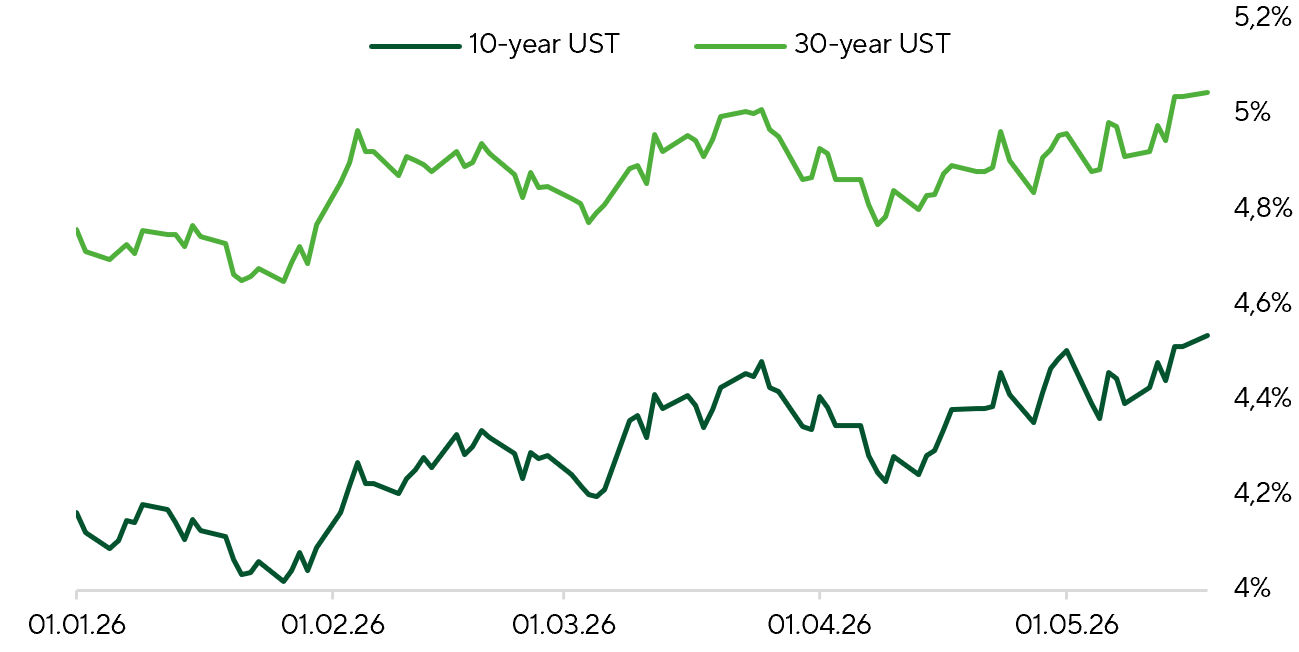
Long-Term Treasury Yield Dynamics.
Source: FactSet, Freedom Broker analysis
Macro drivers were dominated by April CPI, rising producer prices, and the appointment of Kevin Warsh as new Fed Chair. April CPI held elevated inflation pressure, with headline rising 0.64% MoM and core advancing 0.38% MoM. On a YoY basis, inflation printed at 3.8% for headline and 2.7% for core. The main upside surprise was driven less by broad second-round effects from higher oil prices and more by idiosyncratic volatile buckets—housing services, household operations, fuel, and food. As a result, the April print points to a pause in the disinflation trend.
Producer price data printed firmer than expected, with PPI rising 1.4% MoM vs consensus +0.5%, while core PPI advanced 1.0% MoM vs expectations +0.3%. On a YoY basis, headline PPI accelerated to 6.0%, with core moving up to 5.2%. The upside was driven by fuel, trade services, and transportation & storage. However, the jump likely reflects temporary factors—namely a lagged pass-through from last year’s tariffs and second-round effects from higher oil prices—rather than a broad-based reacceleration of inflation pressures.
On the monetary policy side, the key development was the confirmation of Kevin Warsh as Fed Chair on May 16. His policy stance signals an attempt to shift the regime—rate cuts would be paired with balance sheet reduction, lighter banking regulation, and a more active role for the Treasury. The stated objective is to push down long-end yields and support credit expansion across the economy. Markets also focus on Warsh’s push to reshape Fed communication. He favors a less forward-guided Fed—reducing reliance on explicit forward guidance and curbing verbal signaling from policymakers. In practice, this implies a more data-dependent, less pre-committed reaction function, which could increase uncertainty and near-term volatility around FOMC meetings and macro data releases.
Market Focus
One of May’s major catalysts—earnings season—is drawing to a close. Around 93% of S&P 500 constituents and 94% of S&P Small Cap 600 companies have already reported. Large caps delivered strong Q1 results, with aggregate EPS up 28.4% YoY—the best showing in decades, excluding post-crisis rebounds. In small caps, growth was more muted at 5.4% YoY in Q1, but the positive inflection confirms the segment’s exit from an earnings recession, despite growth coming in below expectations. With the remaining reports due over the next two weeks, we highlight several names to watch.
On May 27, Salesforce (CRM) will report results for Q1 FY27. The company heads into the print after a strong end to FY26: Q4 revenue rose to $11.2bn, cRPO accelerated to +16% YoY, and FCF reached $5.3bn. Management guides Q1 revenue to $11.03–11.08bn, so the market’s focus will be on whether organic growth can accelerate in the back half of FY27. The key driver is rapid scaling in AI: Agentforce ARR is $800m, while combined Agentforce and Data 360 ARR exceeds $2.9bn, up over 200% YoY including Informatica. Another positive signal is rising utilization of AI tools—Salesforce processed 771 million Agentic Work Units in Q4. That said, investors continue to debate the durability of the traditional seat‑based SaaS model in an era of AI agents. Even so, robust margins, buybacks, and management’s confidence in long‑term growth underpin the investment case. FactSet’s consensus target price for CRM is $257, implying roughly 43% upside from current levels.
CrowdStrike (CRWD) will report Q1 FY27 results on June 3, entering the print with strong operating momentum after a record Q4: ARR reached $5.25bn, net new ARR was $331m, and FCF amounted to $376m. Management previously guided to Q1 ARR of ~$5.50bn, revenue of $1.360–$1.364bn, and non-GAAP EPS of $1.06–$1.07. Investor focus will center not only on whether the company meets guidance, but also on the trajectory of net new ARR (adjusted for normal seasonality) and commentary on Falcon Flex demand. The key positive driver remains accelerating platform consolidation: Falcon Flex customers now exceed 1,600 and account for approximately $1.69bn of ARR, supporting cross-selling and expanded module adoption. An additional tailwind is growing demand for cybersecurity solutions for AI and AI agent defense, where identity, Pangea, and SGNL play strategic roles. The main risk is the elevated expectations bar after the stock’s strong run: even a beat-and-raise could elicit a measured reaction, particularly as the FactSet consensus target of $516 sits below the current share price.
Geopolitical tensions remain elevated. U.S.–Iran talks continue, but the failure of normal shipping flows through the Strait of Hormuz to resume, a muted news flow, and persistently high energy prices suggest little tangible progress. Polymarket pricing indicates that the probability of a long-term peace agreement being reached between late May and mid-June has declined to roughly 32–43%. Conversely, markets put the odds of a settlement before year-end at about 71%, reinforcing the view that the crisis is likely to be relatively short-lived.
In the coming weeks, the macro calendar highlights the second estimate of Q1 U.S. GDP and a slate of May labor-market data. No major surprises are anticipated. According to FactSet consensus, economic growth is unlikely to be revised, with real GDP remaining at 2.0% on an annualized quarter-over-quarter basis. Labor market conditions are likewise expected to hold steady, with the unemployment rate unchanged from April at 4.3%, underscoring continued employment resilience.
Technical Broad-Market Analysis
The S&P 500 notched a new all-time high just above 7,500 before pulling back, consistent with a transition into consolidation after a near-vertical rally. The RSI hit 77, the highest since July 2024, but has now slipped below 70. If the index pushes to new highs, watch for potential divergence. Primary support is near 7,300 at the 20-day moving average. Pullbacks to this area, as well as to 7,175, may offer favorable entry points for new long exposure. A decisive break above 7,500 could usher in another leg of all-time highs, but the base case remains a continuation of short-term consolidation following the recent strong move. The equal-weighted S&P 500 lags the cap-weighted benchmark and has yet to eclipse its prior closing high. Other indicators confirm that market breadth remains narrow, with the share of stocks trading above their 50-day moving average falling to 47% from 55% over the past two weeks.
Expected Trading Range
The S&P 500 is most likely to trade in the 7,300–7,600 range.