Двухнедельный обзор фондовых рынков №348. Сезонная рокировка

Vadim Merkulov
Head of Analytics department
Northwest Natural Holding. Essential Services
NWN shares are worth buying with a target price of $57
About company
Northwest Natural Holding Company (NWN) is a regulated utility holding company operating across three core platforms: NW Natural, SiEnergy, and NW Natural Water. NW Natural represents the company’s legacy gas distribution business in Oregon and southwest Washington, serving 2 mn people through 810k meters and 14,500 miles of pipeline. SiEnergy expands NWN’s gas distribution footprint into high-growth areas of Texas, serving 225,000 people through 90,000 meters across the Houston, Dallas, Fort Worth, and Austin areas. NW Natural Water provides water and wastewater services across several states, serving 200,000 people through more than 80,000 connections. Historically, NWN was primarily a gas utility focused on the Pacific Northwest; however, its expansion into Texas and the built-out of the water platform have gradually shifted the investment profile toward a more diversified, multi-state regulated utility platform.
| Ticker | NWN |
| Share price as of analysis | $49,6 |
| Target share price | $57 |
| Growth potential | 14,8% |
| Share price dynamics vs. indices | Day | Week | Month | Quarter | Year |
| DLR | -0,4% | 1,5% | 2,5% | -5,6% | 24,9% |
| S&P 500 | 1,7% | 2,0% | 2,0% | 13,9% | 26,4% |
| Russell 2000 | 0,7% | 3,8% | 6,2% | 19,6% | 41,2% |
| DJ Industrial Average | 0,9% | 1,7% | 4,3% | 11,0% | 22,4% |
| NASDAQ Composite Index | 3,1% | 2,9% | 1,7% | 20,7% | 37,5% |
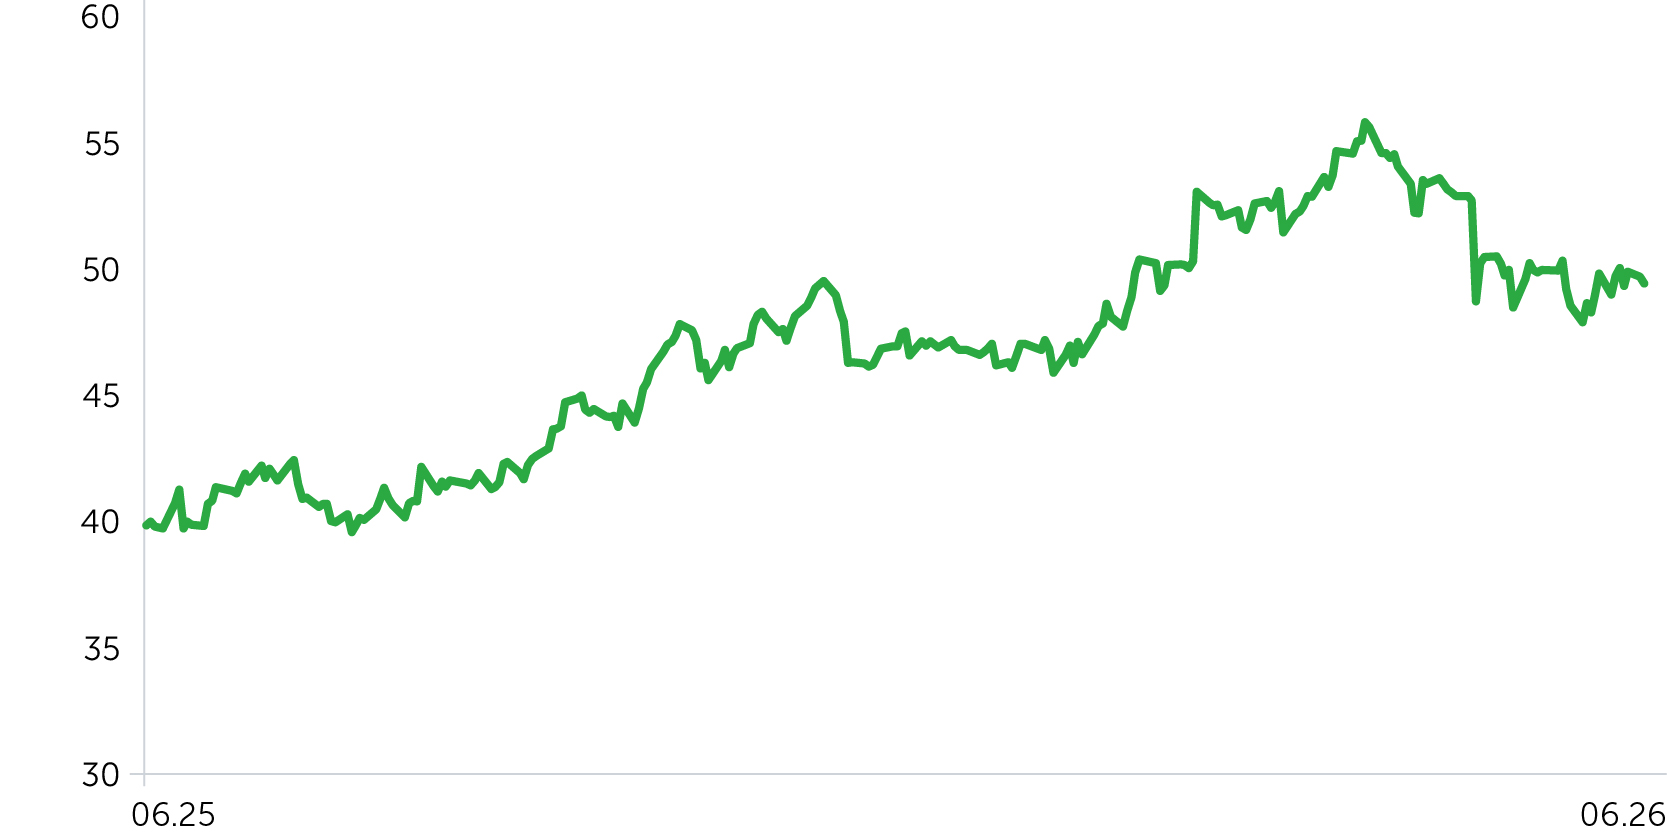
Price dynamics NWN, $
Key Investment Theses
Visible regulated investment program supports rate base growth. NWN’s growth is anchored by a $2.6–$2.9 bn capital investment program for 2026–2030, deployed across NW Natural, SiEnergy, and the water and wastewater platform. Management expects consolidated rate base to grow at a 6–8% CAGR, supported by utility infrastructure investment, customer growth, and projects aimed at improving system safety and reliability.
High-quality gas infrastructure reduces operational risk and supports core business durability. NW Natural’s system has no identified cast iron pipe or bare steel mains, reducing the risk of a large-scale replacement cycle for aging infrastructure. For a regulated utility, this is important because a reliable asset base supports regulatory confidence, lowers the risk of unexpected capital requirements, and strengthens the company’s ability to justify future investment recovery through rates.
Texas gas platform and water business improve the long-term growth profile. SiEnergy is NWN’s fastest-growing platform, with management expecting customer growth of 15–20%, rate base growth of 20–25%, and net income growth of 28–32% through 2030. NW Natural Water adds a second growth vector, with management expecting net income growth of 7–10% and rate base growth of 10–15% through 2030, driven by organic growth, safety-related investments, and subsequent cost recovery through rates.
Long dividend growth track record supports the defensive profile. NWN has increased its dividend for 70 consecutive years and targets a long-term payout ratio of 55–65%. The current annual dividend is $1.97 per share, implying a dividend yield of 4.0%. Combined with a regulated cash flow base and visible rate base growth, this supports dividend sustainability and limits the risk of further valuation downside.
We rate NWN Buy with a target price of $57. We recommend setting a stop-loss at $45.
| Ratio Analysis | 2024A | 2025A | 2026E | 2027E | 2028E | 2029E | 2030E | 2031E |
| ROE | 5,7% | 7,7% | 8,0% | 7,4% | 7,5% | 8,0% | 8,2% | 8,3% |
| ROA | 1,5% | 1,8% | 1,8% | 1,8% | 1,8% | 2,0% | 2,1% | 2,2% |
| ROCE | 4,4% | 5,7% | 5,4% | 5,2% | 5,3% | 5,4% | 5,6% | 5,6% |
| Sales/Assets (x) | 0,23x | 0,23x | 0,21x | 0,22x | 0,20x | 0,20x | 0,20x | 0,20x |
| Interest Coverage (x) | 2,39x | 2,29x | 2,20x | 2,24x | 2,28x | 2,35x | 2,44x | 2,51x |
| Margins, % | 2024A | 2025A | 2026E | 2027E | 2028E | 2029E | 2030E | 2031E |
| Gross margin | 29% | 35% | 35% | 34% | 37% | 38% | 40% | 41% |
| EBITDA margin | 17% | 22% | 22% | 21% | 23% | 24% | 25% | 26% |
| Net Income margin | 7% | 9% | 9% | 9% | 9% | 10% | 11% | 11% |
| Financials, $mln | 2024A | 2025A | 2026E | 2027E | 2028E | 2029E | 2030E | 2031E |
| Revenue | 1 153 | 1 289 | 1 377 | 1 508 | 1 514 | 1 567 | 1 623 | 1 674 |
| Operating Expenses | -962 | -1 008 | -1 073 | -1 184 | -1 166 | -1 188 | -1 214 | -1 240 |
| Operating Income | 191 | 281 | 303 | 324 | 348 | 379 | 409 | 434 |
| Depreciation and Amortization | 138 | 166 | 180 | 195 | 208 | 222 | 235 | 247 |
| EBITDA | 329 | 446 | 483 | 519 | 556 | 601 | 643 | 681 |
| Interest Expenses | 80 | 123 | 138 | 145 | 153 | 161 | 168 | 173 |
| Other Income (Expense), Net | -1 | -4 | -1 | -4 | -4 | -4 | -4 | -4 |
| EBT | 110 | 155 | 165 | 175 | 191 | 214 | 237 | 257 |
| Taxes | -31 | -41 | -40 | -47 | -51 | -56 | -61 | -66 |
| Net Income | 79 | 113 | 125 | 129 | 141 | 158 | 175 | 191 |
| Diluted EPS | $2,03 | $2,77 | $2,97 | $2,96 | $3,09 | $3,37 | $3,67 | $3,89 |
| DPS | $1,96 | $1,97 | $1,98 | $2,06 | $2,12 | $2,29 | $2,46 | $2,57 |