Investment Review №347. In the News
Market Environment as of June 15
Global View
Market performance became more differentiated over the review period. The S&P 500 declined 0.6%, while the remaining major U.S. indices finished higher. Small- and mid-cap equities once again outperformed, with the Russell 2000 gaining 2.2%, the S&P SmallCap 600 advancing 3.9%, and the S&P MidCap 400 rising 2.4%. The equal-weight S&P 500 gained 1.8%, indicating broader participation in the rally despite weakness among the index's largest constituents. Sector performance reflected a clear rotation in leadership. Defensive and cyclical groups led the market, including Consumer Staples, Financials, Real Estate, Utilities, Industrials, and Health Care. By contrast, Information Technology, Energy, Communication Services, and Consumer Discretionary were the primary laggards during the period.
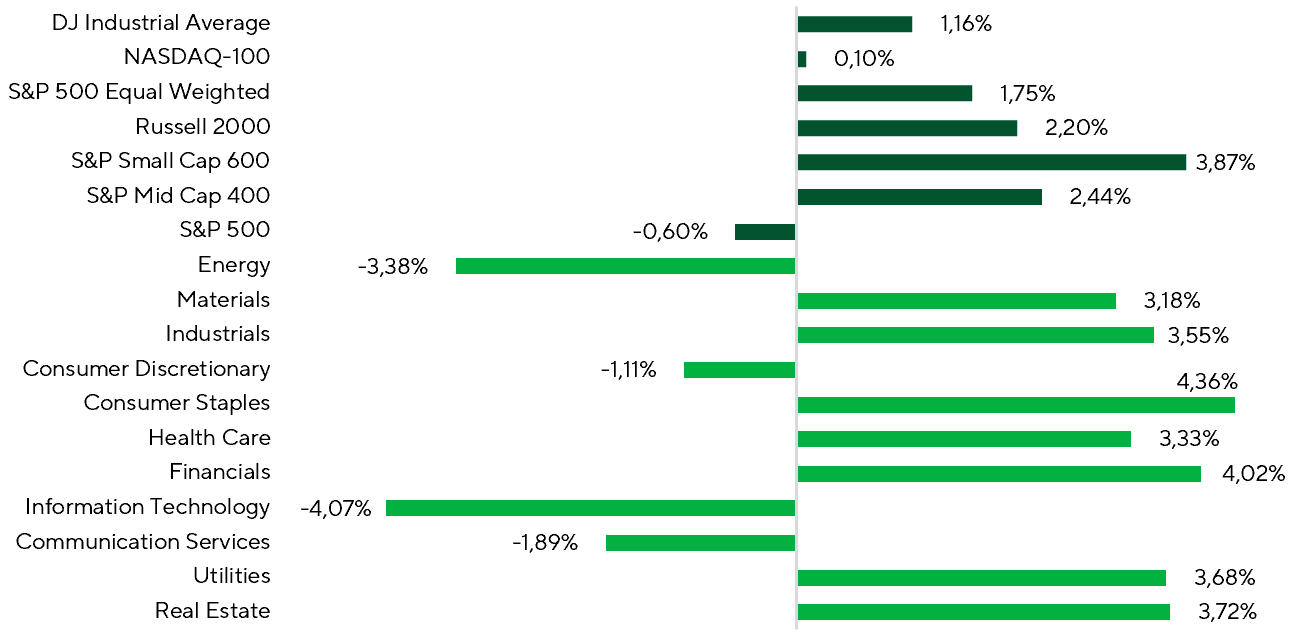
Index and Sector Performance Over the Period
Sources: FactSet, Freedom Broker analysis
Market breadth data further support the broadening of participation. Over the review period, nearly 69% of S&P 500 constituents generated positive returns, compared with just 47% among the index's 15 largest names. Performance was particularly strong across value-oriented segments. Between 64% and 72% of constituents in large-, mid-, and small-cap value indices posted gains, versus 57–61% among their growth counterparts. To a large extent, this pattern reflects profit-taking following the extended rally in technology stocks and a rotation of capital into a broader set of sectors, including companies that are less dependent on the AI theme and trade at more attractive valuations.
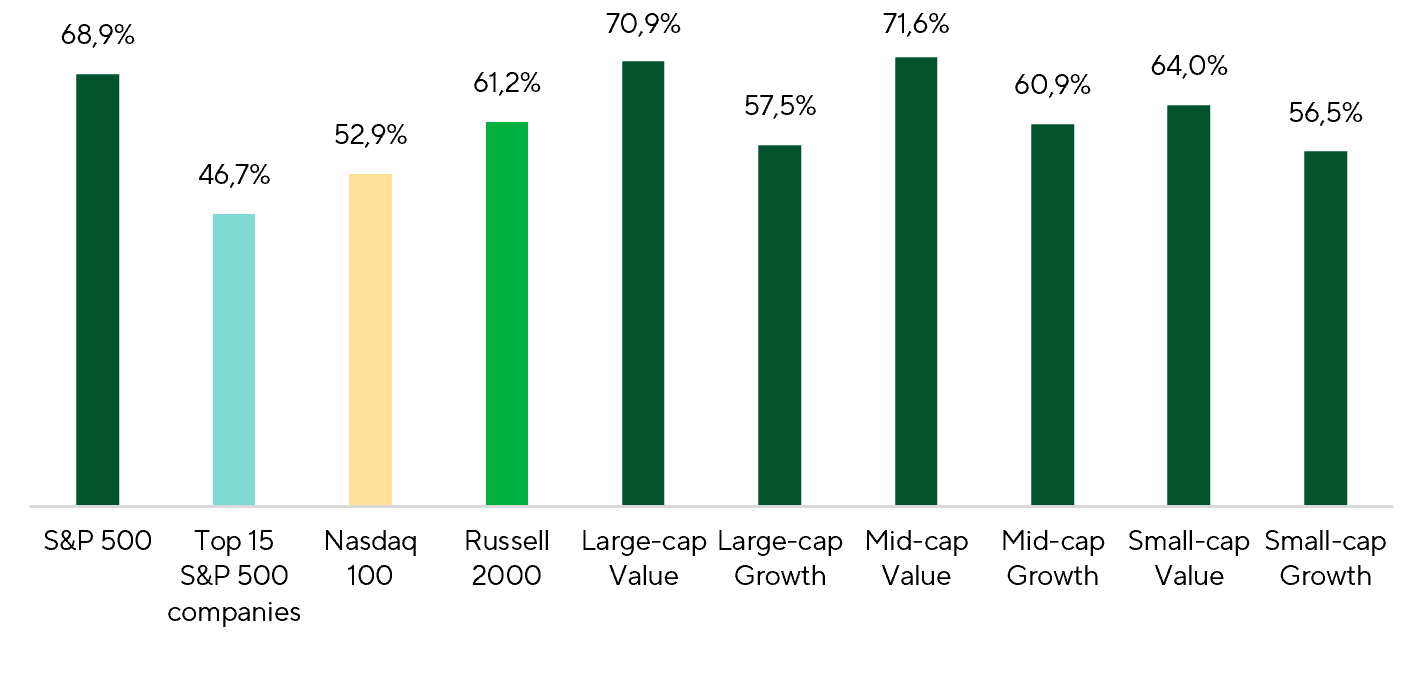
Share of Companies Delivering Positive Returns Across Indices Over the Period
Sources: FactSet, Freedom Broker analysis
Sector-level performance also pointed to broad market participation. More than 75% of constituents in Utilities, Consumer Staples, Industrials, Real Estate, Health Care, Financials, and Materials posted positive returns during the period. By contrast, the weakest breadth was recorded in Information Technology, Communication Services, and Energy, where only 43%, 28%, and 29% of companies, respectively, finished higher. To a large extent, the correction in the largest technology stocks explains why the S&P 500 materially underperformed most other major U.S. equity indices over the period. Meanwhile, the Energy sector remained under pressure as oil prices declined following news of an agreement between the U.S. and Iran.
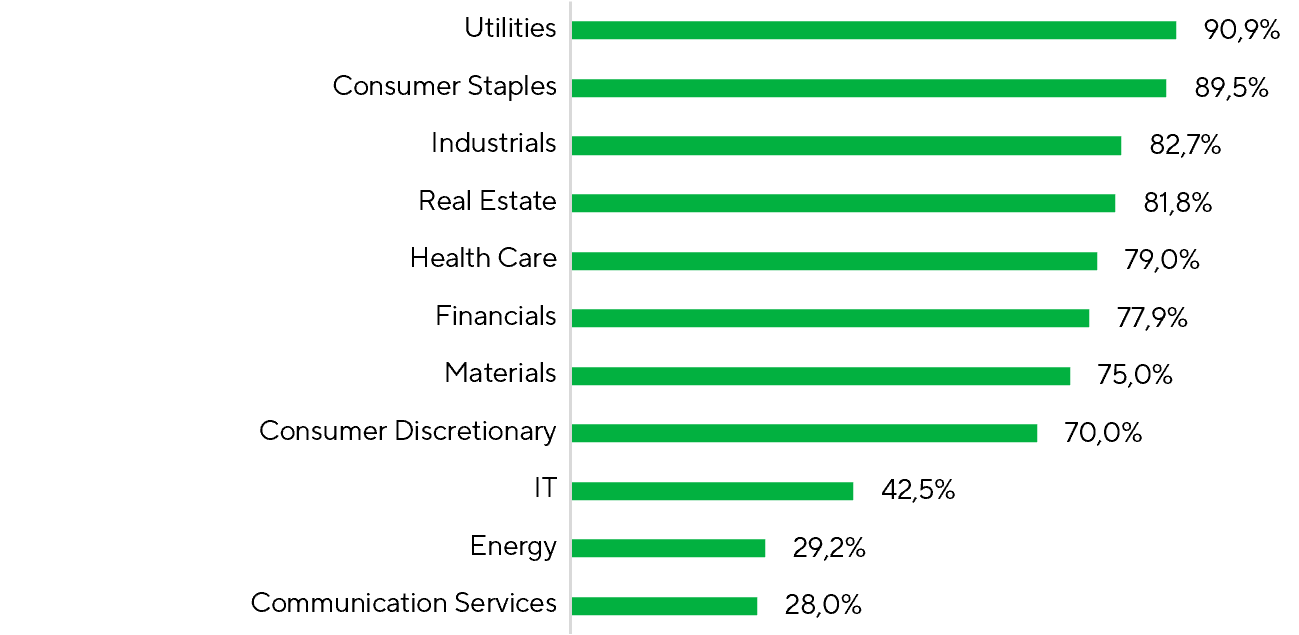
Share of S&P 500 Companies Delivering Positive Returns Across Sectors Over the Period
Sources: FactSet, Freedom Broker analysis
Several key macro releases during the period attracted significant investor attention. May labor-market data came in well ahead of expectations, with nonfarm payrolls increasing by 172k versus consensus forecasts of 88k. In addition, payroll figures for prior months were revised higher. While the market initially reacted negatively on concerns that stronger employment data could support a more hawkish Fed stance, the report primarily points to a labor market that remains resilient rather than overheated. The unemployment rate held steady at 4.3%, while average hourly earnings increased just 0.3% MoM, providing little evidence of accelerating inflation pressures. Overall, the data reinforces the view that the U.S. economy remains on solid footing, while offering limited support for expectations of a meaningful inflation acceleration driven by labor-market conditions.
May U.S. inflation data reinforced the view that underlying price pressures remain contained. While headline CPI rose 0.47% MoM, driven by higher gasoline prices, core CPI increased just 0.21% MoM, coming in ahead of market expectations. The acceleration in headline inflation was largely attributable to energy costs, while most other components remained relatively subdued. Core goods prices declined, and transportation services inflation softened, offsetting part of the upward pressure elsewhere in the basket. Overall, the data suggests that the pass-through from higher oil prices into underlying inflation remains limited, while current trends continue to support a scenario of gradual disinflation over the coming months.
May U.S. PPI data did not signal further acceleration in inflation. The headline index rose 1.1% MoM, largely driven by a jump in fuel prices, while core PPI increased just 0.4% MoM, beating market expectations. An additional positive factor was the downward revision to April data. Price pressure remained concentrated in transportation services, while most other components were broadly in line with recent CPI trends. Overall, the data suggests that recent producer price increases remain largely idiosyncratic and do not point to a sustained acceleration in underlying inflation pressures in the U.S.
Another key macro event was the Fed meeting, the first under Kevin Warsh. After the June 16–17 meeting, the Fed left the federal funds rate unchanged, as expected. The surprise was the guidance. The projected rate path for 2026–2027 moved noticeably higher, alongside the inflation forecast, delivering an unexpectedly hawkish signal for investors. Warsh also set the tone for his communication overhaul by example: he declined to provide his own forecasts. That shift is less investor-friendly. Less guidance means less transparency, less clarity on the Fed’s policy rationale, and a reaction function that is harder to price. Among other takeaways, Warsh announced five working groups to develop his new initiatives: Fed communications, the balance sheet, data sources and the Fed’s reliance on them, productivity and employment amid structural change, and the inflation framework. According to Warsh, the groups will be formed within the next couple of weeks and should complete their work by year-end. The next test is whether these working groups deliver a clearer policy roadmap by year-end.
The corporate spotlight was on SpaceX’s landmark IPO. After nearly 25 years as a private company, SpaceX came to market, following Musk’s December 2025 confirmation of listing plans and a confidential S-1 filing with the SEC on April 1, 2026. The listing followed a major business transformation. In February 2026, SpaceX absorbed Musk’s AI startup xAI, valued at around $250bn, creating a combined entity worth $1.25tn. On June 12, 2026, SpaceX listed on Nasdaq under the ticker SPCX. Demand during the roadshow exceeded supply by almost 4x, with sovereign wealth funds from Saudi Arabia and Kuwait among the anchor investors. Shares jumped to $176.52 in the debut session, lifting SpaceX’s market value above $2tn and pushing Musk’s wealth past $1tn. The IPO also included an overallotment mechanism. SpaceX initially placed 555.6m shares at $135, raising $75bn. With the book almost 4x oversubscribed, underwriters exercised the overallotment option, lifting total issuance to around 638.9m Class A shares and proceeds to $85.7bn, nearly $11bn above the initial deal size. The offering ran from June 12 to June 15, 2026. The final deal size was record-breaking even relative to the already stunning initial figure, cementing SpaceX as the largest stock-market debut in history.
Market Focus
Against a strong finish to the 1Q26 earnings season, expectations for 2Q are moving higher. Since early April, Wall Street consensus has lifted its S&P 500 earnings growth forecast to 21.3% from 17.8%. That points to solid corporate fundamentals, even after factoring in the Iran military operation and higher energy prices. Company guidance is providing additional support. Of the 109 S&P 500 companies that have issued 2Q guidance, 62 raised their earnings outlook, well above recent-year averages. Revenue growth is expected at 12.0% YoY. Energy, Technology, and Materials drove the largest upward revisions. Healthcare remains the only sector where analysts are still cutting earnings expectations.
While the full 2Q26 earnings season has yet to kick off, some companies are already reporting results. Freedom Broker analysts flag Micron (MU) and Nike (NKE) as notable names due in the next two weeks.
Micron Technology (MU) is set to report fiscal 3Q26 results on June 25. The company heads into the print amid an exceptionally strong memory market environment. In 2Q, revenue surged 196% YoY to a record $23.9bn, and management expects to set new records for revenue, margins, and EPS as soon as next quarter. The primary tailwind is surging AI-driven demand that materially outstrips available supply across both DRAM and NAND. Demand is especially robust for HBM used in AI accelerators, server DRAM, and data-center SSDs. Management believes supply constraints will persist at least throughout 2026, supporting elevated pricing. Micron is also rapidly expanding manufacturing capacity and signing long-term agreements with major customers, enhancing future earnings visibility. Investors will focus on the 2H outlook and management’s assessment of the durability of the current memory supply tightness. The consensus price target for MU stock is $955.
Nike (NKE) will release its fiscal 4Q26 results on July 1. The company continues to execute its business transformation program aimed at reaccelerating growth and improving revenue quality. In the prior quarter, revenue was essentially flat year over year at $11.3bn, while EPS declined 35% to $0.35, reflecting elevated tariffs, restructuring costs, and ongoing efforts to right-size excess inventory. North America remained a bright spot, with sales up 3% and wholesale rising 11%. The running and football (soccer) segments delivered particularly strong momentum, posting double‑digit growth. Management also cited improving partner orders and a gradual recovery in market share. Key investor debates center on the pace of recovery in China and Europe, as well as the gross margin trajectory as the inventory reduction program winds down. The company expects tariff pressure to begin easing as early as fiscal 2H27, which should support profit recovery. The consensus price target for NKE shares is $59.
Another key market catalyst over the next two weeks will be geopolitical developments. Since early June, WTI has declined 12.9% on rising expectations of a U.S.-Iran agreement, while, in our view, that optimism is overdone. The memorandum the parties signed is only an interim roadmap for the next two months of negotiations, not a final settlement. That said, the sides remain far apart on core issues—Iran’s nuclear program, shipping through the Strait of Hormuz, and regional security—complicating any prospect of a durable agreement.
In the near term, oil price action will hinge primarily on developments around the Strait of Hormuz. A full restoration of shipping could prompt a rapid reassessment of the supply-demand balance. OPEC+ members have already raised oil production quotas and, in our view, are likely to continue increasing them through year-end, adding further downward pressure on prices. If the conflict de-escalates, the UAE’s plan to materially lift output following its withdrawal from the OPEC+ agreement could accelerate the decline in global oil prices.
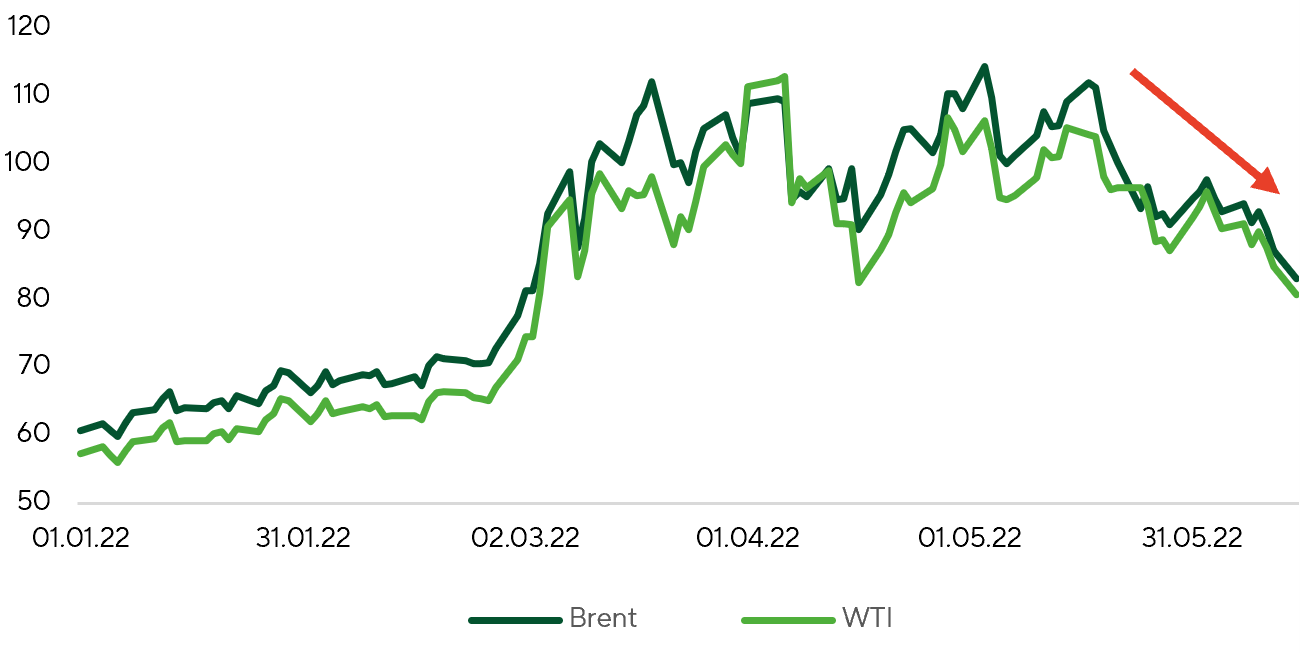
Brent and WTI ($ per barrel)
Source: FactSet, Freedom Broker analysis
Broad Market Technical Analysis
The S&P 500 remains in consolidation, having slipped back below its 20-day moving average near 7,480. The short-term outlook is neutral, with the index range-bound between 7,240 and 7,620. The RSI has eased to 50, signaling waning momentum without oversold conditions. Near-term resistance sits around 7,550, with key resistance still at 7,620. Primary support is clustered in the 7,240–7,300 zone, anchored by the 50-day moving average. Holding that band would preserve the prevailing uptrend and keep the odds high that the advance resumes once the consolidation phase ends. A deeper retracement toward roughly 7,000 cannot be ruled out, but this is not the base case. A sustained break above 7,620 would confirm renewed buying interest and open the door to new highs. Market breadth has improved modestly, with 53% of constituents now trading above their 50-day moving averages.
Expected Trading Range
We expect the S&P 500 to trade within a 7,300–7,620 range.