Investment Review №331. At zero
Corporate News In Focus of Our Analysts
Apple
Apple Inc. (AAPL) is set to release quarterly results in the coming weeks, and all indications are that the report will be strong. Apple is performing a large-scale upgrade of its product line, and in addition to the released iPhone 17 and Air, the company has recently introduced an updated M5 chip and devices based thereon. Apple’s key chip supplier, TSMC, has lately reported quarterly results, demonstrating impressive smartphone sales, which indicates strong demand for Apple products. Initial estimates of iPhone shipments from independent smartphone supply analytics agencies reveal that new iPhones are highly demanded, not only in the U.S. and Apple’s new fast-growing regions, but also in China. According to Counterpoint Research, the only smartphone brands whose Chinese deliveries increased in Q3 were Apple and Oppo. Amid growing investor optimism ahead of the quarterly report, AAPL shares have risen 6% over the past week and are testing new all-time highs.
AAPL price dynamics over the last 12 months, $
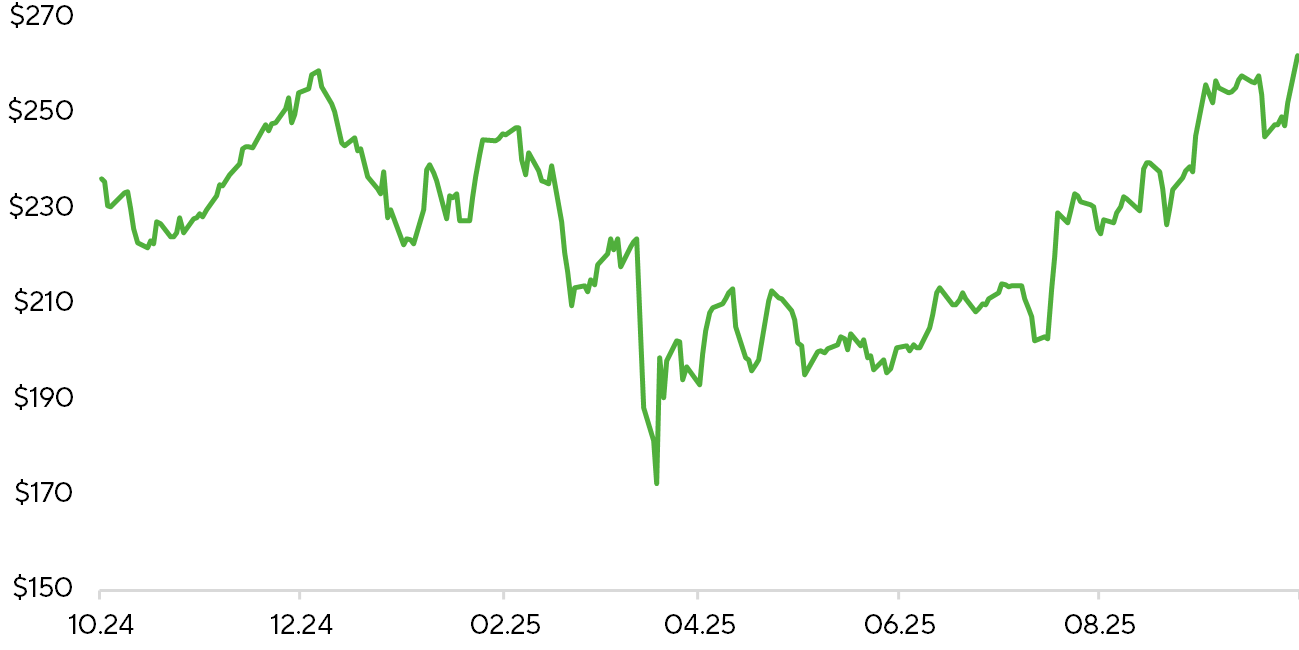
Sources: FactSet, Freedom Broker
Zions, Western Alliance
Last week, there appeared concerns over the regional banks Zions (ZION) and Western Alliance (WAL), caused by an identified series of fraudulent commercial real estate loans and defaults, which prompted a drop in stock prices and worries about the quality of regional bank portfolios:
- Zions decided to create a reserve of about $60 million and charge off $50 million of this amount for two commercial loans after identifying fictitious data and borrower obligation violations.
- Western Alliance filed a lawsuit against a borrower, accusing them of fraud and violation of the terms of the collateral agreement. After revaluation of the assets, the bank reaffirmed that their value was enough to cover the loan obligations. The deal also included guarantees from two wealthy guarantors.
The financial conditions of the banks indicate they can absorb the losses incurred with no significant trouble for business sustainability and resist the outflow of deposits.
In isolation, these two episodes do not look critical for both the banking system and the two banks. However, should the situation persist, with a wave of bankruptcies sweeping through the economy, regional banks will be under pressure.
ZION and WALL Financial and Credit Metrics for Q3 and Q4 2025
| Ratio analysis | ZION | WAL |
| Reserves / Non-performing loans | 213,0% | 92,0% |
| Write-offs / Loan portfolio | 0,37% | 0,22% |
| Capital adequacy | 11,3% | 11,3% |
| Liquidity / Uninsured deposits* | 118% | 153% |
| Credit rating, Fitch | BBB+ | BBB |
Sources: FactSet, bank data, Freedom Broker analysis.
*latest available data based on Q2 2025 results
Delta Air Lines, United Airlines
Delta (DAL) and United (UAL) Airlines reported good results for Q3 2025, but there were nuances. Delta looks a little more confident due to revenue growth and a robust cash flow. United, in turn, generates excellent earnings per share, but marginality still spawns doubts. Investors should keep an eye on how steadily the premium segment and business traffic of both airlines are expanding.
On October 9, Delta reported for Q3 2025, with adjusted revenue of $15.2 billion (up ~4.1% y/y). Adjusted operating margin was 11.2%, and adjusted earnings per share stood at $1.71. Management noted the strengthening of business and premium traffic, an improvement in fundamental demand indicators, and provided guidance for Q4: revenue growth of 2-4% y/y and margin in the range of 10.5-12%.
On October 15, United recorded revenue of $15.2 billion for Q3 2025, an increase of 2.6% y/y but slightly below analysts’ expectations. Adjusted EPS reached $2.78, which is higher than the forecasts of the market and the company. United highlighted the growth of premium seats and loyalty program revenues. However, excessive schedule growth raises concerns about the future trajectory of profitability. The management has provided the EPS guidance for Q4 in the range of $3.00-3.50.
Share prices (indexed)
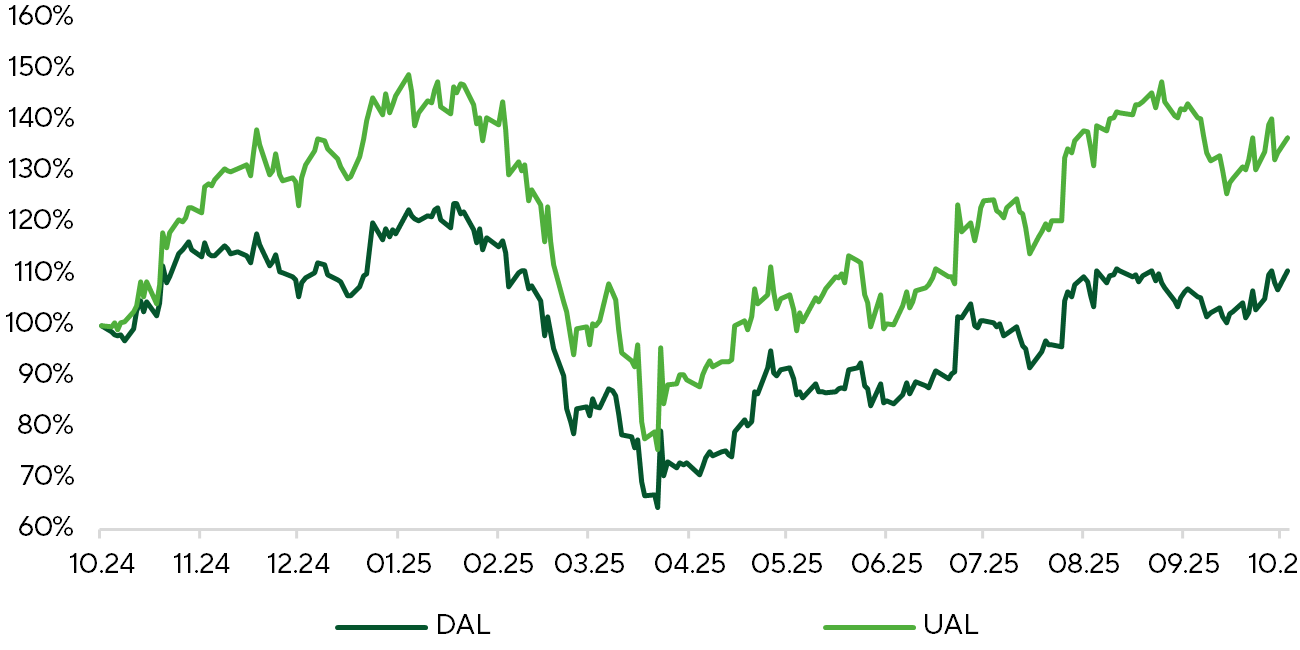
Source: FactSet
Oracle
On October 16, during the last day of Oracle AI World 2025, Oracle Corp. (ORCL) provided revised long-term financial forecasts. Oracle presented ambitious long-term financial goals that significantly exceeded the expectations of market participants and the benchmarks outlined in the company’s latest quarterly report. Oracle predicts reaching $225 billion in revenue by FY 2030, which corresponds to a CAGR of 31%. Management estimates that EPS will be $21 by the end of the decade. Before the event, investor consensus for FY 2030 projected revenue and EPS at $200 billion and $18.5 billion, respectively. Earlier, it was actively discussed that Oracle’s gross margin on leasing Nvidia chip-based servers did not exceed 20%, but management denied the information. Despite strong financial forecasts and dispelled concerns about profitability, some investors are again questioning the attainability of the promised results. Two days after the conference, ORCL’s share price was down by almost 12%.
Oracle's financial forecasts for FY 2030
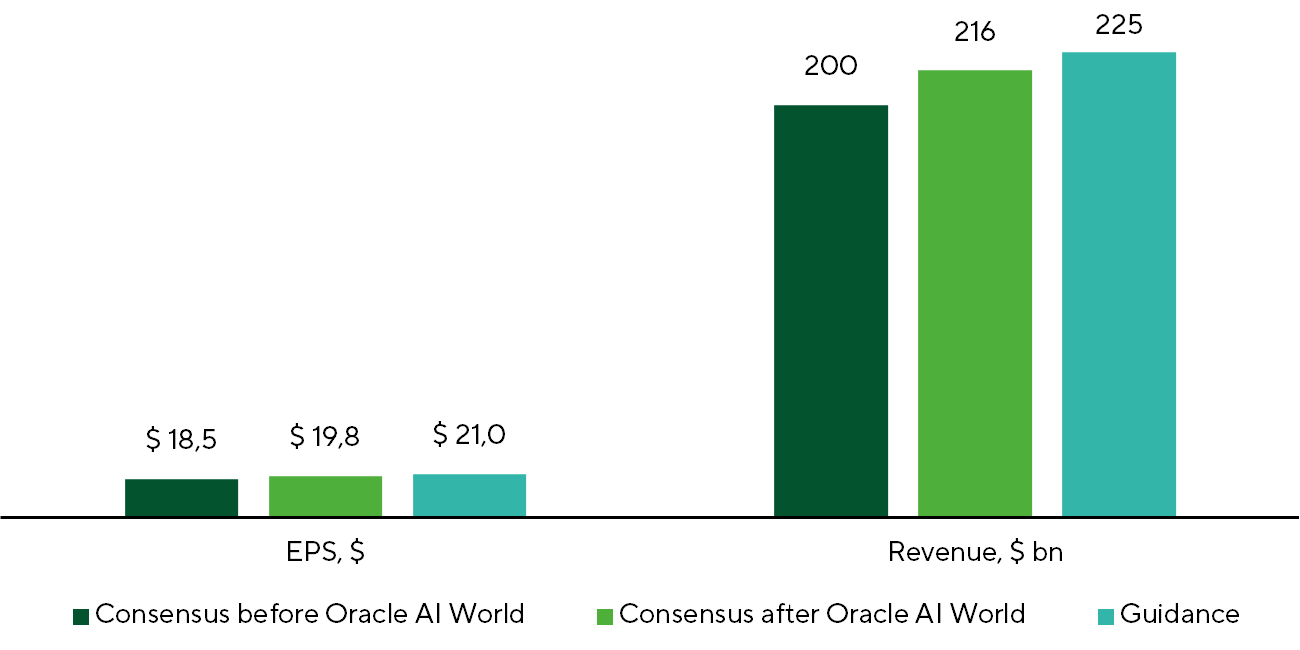
Sources: FactSet, Oracle, Freedom Broker
J.P. Morgan
The largest U.S. banks have completed the Q3 2025 earnings season, delivering results above expectations. EPS growth exceeded revenue dynamics due to active share buybacks and lower loan loss provisions. JPM (JPM) was the exception, increasing its provisions to the highest level since the pandemic. The lending momentum persists, with the corporate segment once again outpacing the retail segment. Banks highlight stable asset quality and a lower proportion of bad loans, especially in the consumer portfolio.
The main driver of the quarter was non-interest income, which increased due to continued investment banking activity and growth of asset management fees. Trading results also exceeded expectations, especially in fixed income instruments and currencies. Banks remain optimistic about the continued recovery of the M&A market but emphasize that growth rates will depend on macroeconomic stability.
Financial institutions are seeing further improvements in profitability and efficiency, due to digitalization and cost reduction. High capital reserves and easing regulatory requirements set the stage for returning capital to shareholders through dividends and buybacks.
Comparative Analysis of Banks
| Ticker | Efficiency | ∆ | EPS | ∆ | Capital per share | ∆ | RoTE | ∆ | P/E | P / Tangible Book | Target price | Current price | Potential | ||||||
| LTM | NTM | p.p. | LTM | NTM | % | LTM | NTM | % | LTM | NTM | p.p. | LTM | NTM | LTM | NTM | ||||
| JPM | 52,6% | 53,3% | 0,7 | 20,2 | 20,8 | 2,9% | 125,0 | 132,7 | 6,2% | 20,7% | 19,5% | -1,2 | 14,7 | 14,3 | 2,84 | 2,63 | 310 | 297,1 | 4% |
| BAC | 64,4% | 61,9% | -2,5 | 3,7 | 4,2 | 15,8% | 38,0 | 40,2 | 5,9% | 13,8% | 14,9% | 1,1 | 14,0 | 12,1 | 1,81 | 1,70 | 59 | 51,5 | 15% |
| C | 64,1% | 61,5% | -2,6 | 7,1 | 9,3 | 31,1% | 108,4 | 118,1 | 9,0% | 7,9% | 9,7% | 1,8 | 13,8 | 10,5 | 1,03 | 0,95 | 115 | 98,3 | 17% |
| WFC | 66,5% | 63,2% | -3,2 | 6,1 | 6,8 | 11,7% | 52,3 | 55,3 | 5,8% | 14,5% | 15,2% | 0,8 | 14,0 | 12,5 | 1,91 | 1,82 | 96 | 84,8 | 13% |
| GS | 61,5% | 61,3% | -0,2 | 49,2 | 53,9 | 9,4% | 352,5 | 375,4 | 6,5% | 15,5% | 16,0% | 0,5 | 15,4 | 14,1 | 2,31 | 2,15 | 794 | 759,0 | 5% |
| MS | 68,8% | 68,5% | -0,2 | 9,7 | 10,3 | 5,5% | 63,0 | 67,3 | 6,8% | 21,1% | 20,4% | -0,7 | 16,3 | 15,5 | 3,57 | 3,00 | 161 | 159,2 | 1% |
Sources: FactSet, bank data, Freedom Broker analysis