Investment Review №331. At zero

Vadim Merkulov
Head of Analytics department
ServiceNow. At the forefront of digitalization
NOW shares are attractive for purchase with a target price of $1,100
About company
ServiceNow, Inc. (NOW) is a U.S. company founded in 2004 and headquartered in Santa Clara, California. The company is a developer of cloud platforms for automating business processes and digital workflow, including IT services (ITSM) and operations management (ITOM), as well as security (SecOps), client, and HR operations management; it is also a workspace creator. The key product is the Now Platform, which, through built-in AI tools and generative AI agents (Now Assist, AI Control Tower), provides a comprehensive digital transformation for enterprises. ServiceNow’s clients are major global corporations and government organizations that use the company’s solutions to optimize operational efficiency and reduce costs.
| Ticker | NOW |
| Share price as of analysis | $906,55 |
| Target share price | $1100 |
| Growth potential | 21,74% |
| Share price dynamics vs. indices | Day | Week | Month | Quarter | Year |
| NOW | 1,0% | 1,7% | (4,9%) | (5,8%) | (1,5%) |
| S&P 500 | 0,5% | 0,1% | (0,0%) | 5,8% | 13,6% |
| Russell 2000 | (0,6%) | (0,4%) | 0,1% | 9,5% | 7,7% |
| DJ Industrial Average | 0,5% | 0,3% | (0,3%) | 4,2% | 6,7% |
| NASDAQ Composite Index | 0,5% | 0,1% | 0,2% | 8,5% | 22,7% |
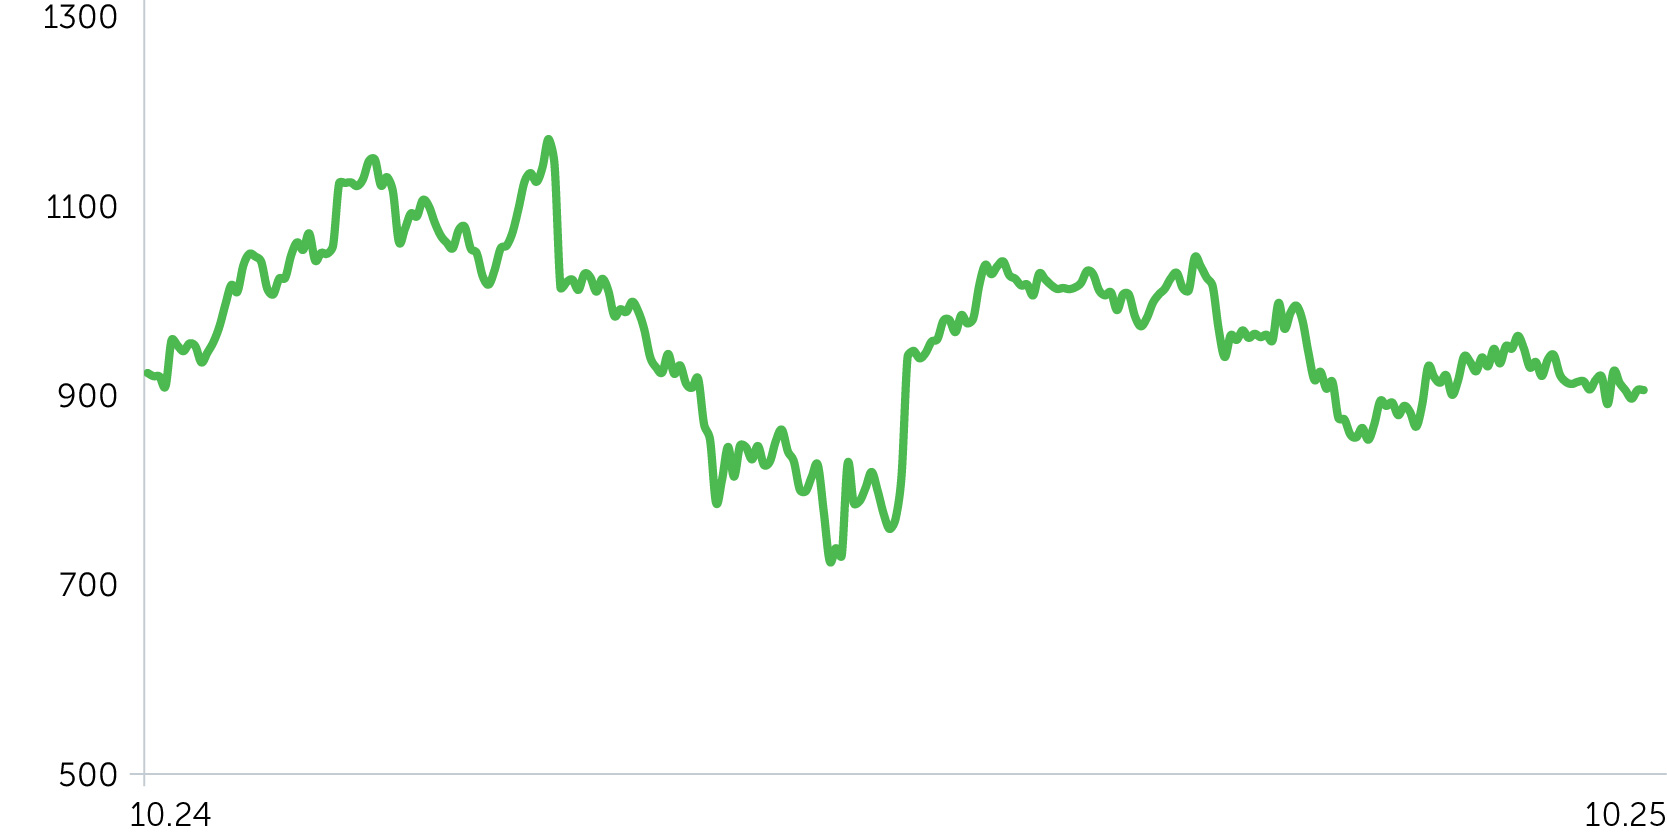
Price dynamics NOW, $
Key Investment Theses
- Transition to a Multi-Product Platform. ServiceNow has transformed from an IT Workflow management leader into a multi-purpose platform company, expanding into the Employee, Customer and Creator Workflows areas. The company has 12 organically built businesses with more than $250 million in ARR (annual recurring revenue) each, providing a variety of growth vectors and confirming the efficiency of its broader platform strategy. As its core product, IT Service Management, scales, the ongoing development of both additional IT solutions and non-IT workflow products will become a key growth driver on the way to $15 billion in subscription revenue.
- Federal Spending Recovery and Contract Simplification. After a prolonged period of inactivity in Q1 and the first half of Q2, U.S. federal spending on ServiceNow experienced a “complete turnaround” after the Knowledge conference. The IRS (U.S. Internal Revenue Service), the U.S. Census Bureau, and the Department of Defense have stepped up the use of ServiceNow. In addition, the removal of the Carahsoft intermediary in federal licensing is expected to reduce bureaucratic hurdles and cycles, enabling agencies to directly obtain licensing and implementation contracts, which should have a positive impact in Q4 and beyond.
- AI Integration as a Catalyst. ServiceNow’s clear definition of AI at the Knowledge 2025 conference, coupled with the introduction of AI into existing products, was a significant catalyst. Many U.S. federal projects were acquired years ago without AI, but ServiceNow’s new AI capabilities have restored the value of previous federal purchases and acted as a driver of government spending recovery. Partners note that ServiceNow’s AI products are now ready for real deployment in enterprises, with a focus on Control Tower (a centralized platform for managing, monitoring, and controlling all of the company’s AI-related initiatives) for secure orchestration of both native and third-party agents.
The target price for NOW shares is $1,100.0, with a “Buy” recommendation. A stop-loss order is advisable at $777.0.
| Margins, % | 2022А | 2023А | 2024А | 2025E | 2026E | 2027E | 2028E | 2029E | 2030E |
| Gross margin | 82% | 82% | 83% | 81% | 81% | 80% | 82% | 83% | 82% |
| EBITDA margin | 32% | 33% | 35% | 35% | 36% | 37% | 38% | 36% | 37% |
| Net profit margin | 21% | 25% | 26% | 27% | 27% | 28% | 28% | 28% | 25% |
| Ratio Analysis | 2024А | 2025E | 2026E | 2027E | 2028E | 2029E | 2030E |
| ROE | 30% | 28% | 24% | 22% | 22% | 22% | 22% |
| ROA | 14% | 14% | 14% | 14% | 14% | 14% | 14% |
| ROCE | 27% | 26% | 24% | 23% | 24% | 25% | 28% |
| Sales/Assets | 0,54x | 0,52x | 0,50x | 0,49x | 0,49x | 0,49x | 0,55x |
| Interest Coverage | 10,21x | 13,69x | 17,98x | 22,18x | 10,12x | 7,62x | 7,65x |
| Financials, $mln | 2022А | 2023А | 2024А | 2025E | 2026E | 2027E | 2028E | 2029E | 2030E |
| Revenue | 7 245 | 8 971 | 10 984 | 13 164 | 15 629 | 18 600 | 21 924 | 25 559 | 29 613 |
| COGS | 1 275 | 1 590 | 1 907 | 2 438 | 2 859 | 3 396 | 3 805 | 4 420 | 5 428 |
| Gross profit | 5 970 | 7 381 | 9 077 | 10 676 | 12 633 | 14 836 | 17 976 | 21 138 | 24 185 |
| SG&A | 5 317 | 6 288 | 7 333 | 8 796 | 10 447 | 12 422 | 14 699 | 17 063 | 17 404 |
| EBITDA adj. | 2 293 | 2 966 | 3 817 | 4 590 | 5 571 | 6 888 | 8 390 | 9 273 | 11 009 |
| D&A | 433 | 477 | 563 | 569 | 638 | 801 | 905 | 505 | 636 |
| EBIT adj. | 1 860 | 2 489 | 3 254 | 4 021 | 4 934 | 6 088 | 7 485 | 8 768 | 10 373 |
| Net interest | 44 | 246 | 374 | 335 | 310 | 311 | 829 | 1 217 | 1 440 |
| EBT adj. | 1 904 | 2 735 | 3 628 | 4 356 | 5 244 | 6 398 | 8 314 | 9 985 | 11 813 |
| Tax | 361 | 520 | 726 | 884 | 1 062 | 1 280 | 1 636 | 2 001 | 2 367 |
| Net Income | 1 543 | 2 215 | 2 902 | 3 536 | 4 252 | 5 208 | 6 119 | 7 066 | 7 327 |
| Dilluted EPS | $7,59 | $10,78 | $13,92 | $16,86 | $20,02 | $24,14 | $27,06 | $32,59 | $32,84 |
| DPS | $- | $- | $- | $- | $- | $- | $- | $- | $- |