Investment Review №343. The return of the bulls
Review as of April 20
Global View
Over the past two weeks, U.S. equities have delivered a sharp, high-amplitude rally, with market structure flipping from bearish to bullish at an unusually rapid pace. On April 17, the NASDAQ-100 posted its 13th consecutive positive close—the longest winning streak since 1992.
Momentum extended beyond price action. Based on RSI dynamics, the S&P 500 moved from oversold to overbought in just 11 sessions, marking the fastest reversal since 1982. As a result, all major benchmarks closed the two-week period firmly higher: the S&P 500 gained 7.5%, the Dow Jones Industrial Average rose 5.9%, and the Nasdaq advanced 9.9%. Breadth improved as well. The Russell 2000 and S&P MidCap 400 increased 9.9% and 7.2%, respectively. The speed and magnitude of the reversal have pushed several benchmarks back to and, in some cases, through prior all-time highs.
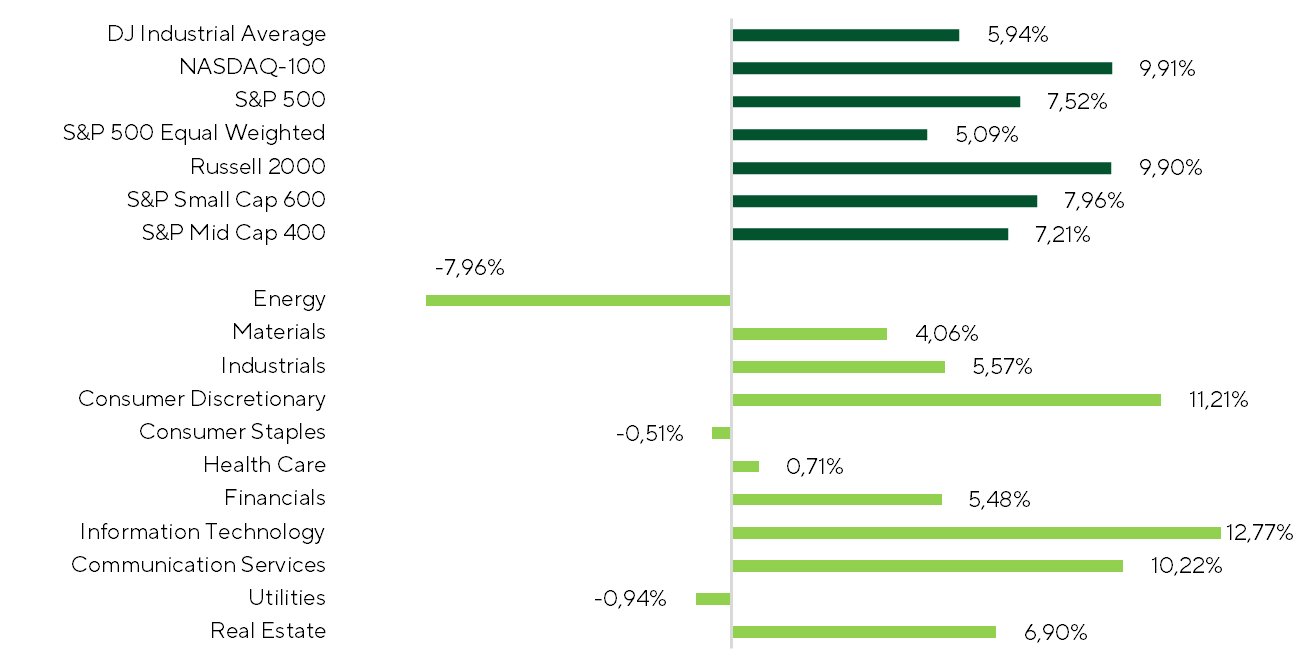
Index and Sector Returns Over the Period
Source: FactSet, Freedom Broker analysis
The rebound was notably broad-based, with 73.5% of constituents in the S&P 500 posting positive returns over the period. In small caps, more than 86.0% of companies in the Russell 2000 closed higher. The median return reached +4.3% for the S&P 500 and +7.3% for the Russell 2000, reinforcing the case for a broad-based risk-on move.
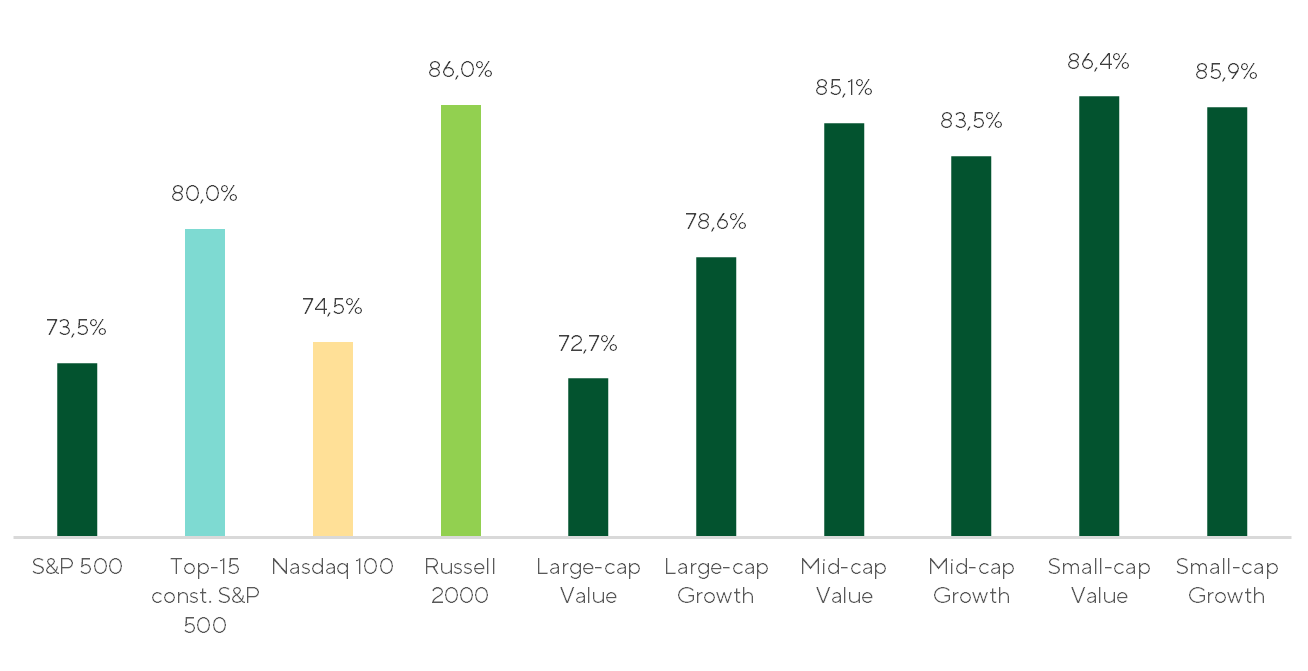
Share of Companies with Positive Returns Across Indices Over the Period
Source: FactSet, Freedom Broker analysis
The dominant driver over the period was a rapid compression of the geopolitical risk premium. The ceasefire between the U.S. and Iran held, while shipping through the Strait of Hormuz remained volatile but functional, with intermittent normalization — including 11 vessels transiting on April 17. As a result, markets progressively priced out a prolonged energy shock scenario, with Brent crude oil falling more than 13% over the period.
In a regime of elevated sentiment volatility and high headline sensitivity, reassessing the external environment is critical—specifically, how expectations have shifted and which drivers are likely to define the next phase.
Framed through the lens of growth and inflation, the evolution since the start of the year is clear. On the growth side, assumptions have not only held but strengthened. Expectations for U.S. real GDP continue to point to a stable expansion path without overheating. As of April 17, Bloomberg consensus sees 2026 GDP growth at 2.20% YoY, up from 2.00% at the start of the year. A similar pattern is evident at the corporate level. Earnings expectations for S&P 500 companies remain robust, with consensus now projecting EPS growth of 17.8% YoY for 2026, up from 13.8% previously. Bottom line: the growth impulse remains intact and increasingly supported by upward revisions, signaling underlying strength across both the macro backdrop and corporate earnings cycle.
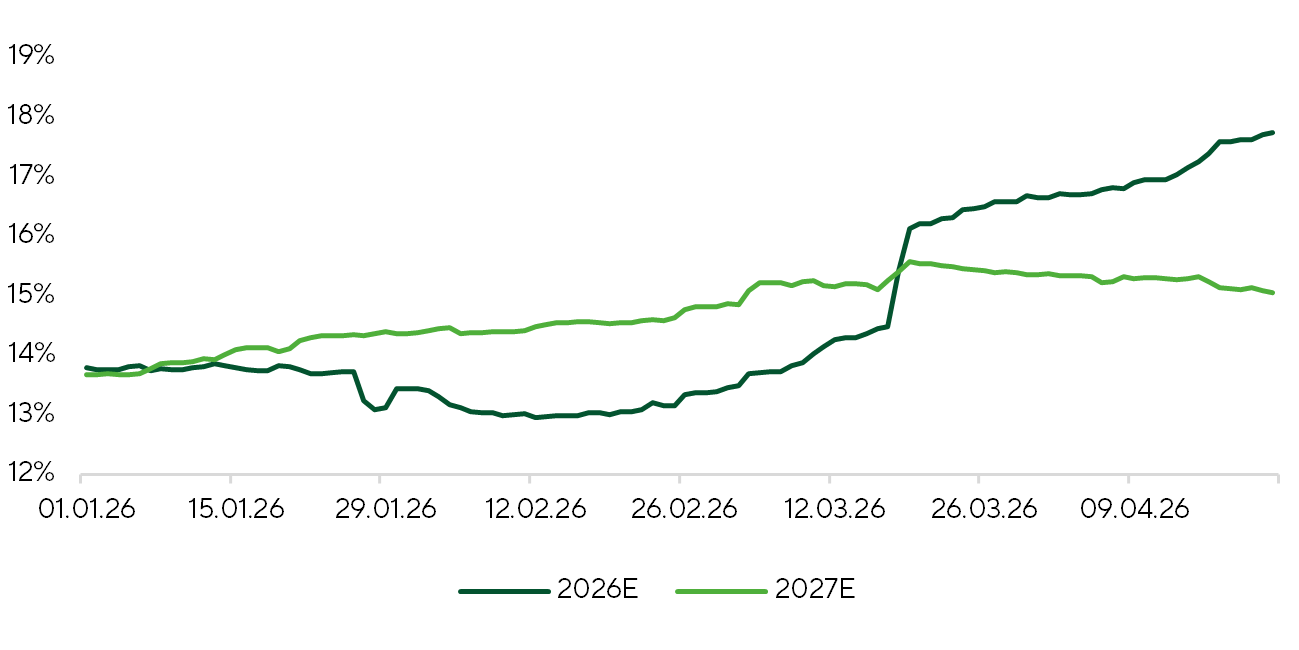
S&P 500 Earnings Growth Expectations
Source: FactSet, analysis Freedom Broker
At the same time, the second key variable—inflation—has shifted higher. At the start of the year, the market was anchored to a disinflation narrative, with end-2026 CPI expectations around ~2.8%, consistent with a two-cut Fed path (~50bps). Since then, expectations have drifted up. Bloomberg consensus now points to ~3.1% YoY, implying a more neutral policy trajectory.
In macro terms, the framework is tilting away from “Goldilocks” toward a mild reflation regime—solid growth with a modest uptick in inflation. Crucially, the market continues to treat the inflation impulse as transitory. As conditions around the Strait of Hormuz normalize and energy prices cool, price pressures are expected to ease. The current move is therefore seen as a temporary adjustment, not a systemic risk. On this basis, portfolio positioning should gradually rotate toward cyclicals—IT, Communication Services, Consumer Discretionary, Industrials, and Materials—while retaining a defensive overlay given persistent macro uncertainty.
Focus is shifting from geopolitics to earnings, with the 1Q26 season gaining traction. Early prints point to a resilient corporate backdrop. Roughly 20% of the S&P 500 (102 companies) and 12% of the S&P SmallCap 600 (74 companies) have reported. Aggregate EPS growth remains solid: +14.4% YoY for the S&P 500 and +5.6% YoY for the S&P 600. It’s early, but the signal is supportive.
Among the key macro releases over the past two weeks, the March inflation report stands out. Headline CPI rose 0.87% MoM, broadly in line with the 0.9% consensus forecast, while core CPI, excluding food and energy, remained modest at 0.2% MoM, slightly below the 0.3% consensus. On a 12-month basis, CPI stands at ~3.3% YoY headline and ~2.6% core. The spike was energy-led. Fuel prices rose +10.9% MoM, with gasoline up +21.2% amid the oil shock — a largely anticipated driver. Strip out energy and the picture is contained: food flat, core goods +0.1% MoM, and services ex-fuel +0.23% MoM. Even in transportation services, where fuel accounts for roughly 11–13% of costs and the pass-through from higher oil prices could have been most pronounced, price growth came in below our expectations at just 0.61% MoM.
Market Focus
Over the next two weeks, market direction will be driven by three variables: (1) the trajectory of U.S.–Iran negotiations and energy prices, (2) the earnings season, and (3) key macro prints, notably the first estimate of 1Q26 GDP and April labor market data.
The U.S.–Iran negotiation process continues to anchor the external backdrop. The extension of the ceasefire, combined with the U.S. naval blockade, has effectively created a two-sided pressure mechanism, likely tilting the balance against Tehran.
Oil price dynamics over the next two weeks will depend on developments around the Strait of Hormuz. If the ceasefire holds alongside the current “dual blockade” dynamic, we expect a gradual firming in oil prices. Conversely, a reopening of Hormuz—via negotiation or military action—could trigger a sharp repricing lower, with WTI potentially falling below $60/bbl over a one-month horizon. A reopening would also unlock a rapid normalization in flows, with oil, refined products, and LNG production and exports rebounding quickly. On the supply side, OPEC+ has already increased quotas by 206 kb/d in April and is set to add a similar increment in May. Looking further out, we see scope for up to ~1.2 mb/d of additional supply in 2026, which would likely shift the market into surplus and cap prices.
The earnings season will continue to gain momentum. Over the next two weeks, more than 280 constituents of the S&P 500 are set to report. Within this cohort, market attention is concentrated on three names: Microsoft (MSFT), Alphabet (GOOGL), and Palantir Technologies (PLTR).
Alphabet (GOOGL) reports on April 29. Following 4Q25, the stock sold off ~20% on concerns around elevated CapEx ($175–185bn) and ROI, despite a top-line beat and strong Google Cloud margin expansion. Since then, shares have fully retraced and are back to pre-earnings levels. The recovery has been driven by Google Cloud acceleration, supported by TPU deployment and a multi-year partnership with Anthropic. At the same time, Alphabet is actively defending its core franchise against OpenAI and Perplexity AI through AI Overviews, AI Mode, and Gemini integration across its ecosystem. The setup into earnings is clear: sustained cloud acceleration, margin expansion, and resilient advertising—coupled with early monetization of Gemini—are key to rebuilding confidence in growth durability and CapEx efficiency. Our 12-month target price for GOOGL is $365.
Microsoft Corp. (MSFT) will also report fiscal 3Q results on April 29, with the stock already down 10.5% year-to-date. The prior quarter triggered a sharp negative reaction, driven by Azure deceleration and high exposure (~45%) to OpenAI, amid the latter’s market share erosion. Into this print, expectations are low, but clear upside catalysts are limited. We expect a material upward revision to CapEx, reflecting both strong demand and rising data center costs, with margin pressure weighing on FCF. A potential upside lever is M365 Commercial, where the new E7 package could lift ARPU, though early adoption appears muted based on channel checks. Valuation is more attractive, but OpenAI dependency, FCF pressure, and slow product uptake argue for caution into earnings. Our 12-month target price for MSFT is $600.
On May 5, Palantir Technologies (PLTR), a leader in AI-driven analytics for government and enterprise clients, will report its 1Q26 results. The stock has corrected alongside broader software weakness following new model releases from Anthropic—a move we view as disconnected from fundamentals. In the prior quarter, the company delivered accelerating growth in U.S. commercial, driven by client additions, Boot Camp conversions, and rising TCV. The government segment remained stable, supported by contract renewals.
Management is guiding for 70%+ YoY revenue growth in 1Q, alongside further GAAP margin expansion. With a strong pipeline, AIP cross-selling, and increasing deal sizes, the setup supports another beat on both revenue and earnings. Our 12-month target price for PLTR is $170.
Turning to macro, the advance estimate of 1Q GDP is due on April 30. The market is pricing in 2.3% QoQ annualized growth, reinforcing the narrative of resilient U.S. momentum. On May 8, April labor market data will be released. Consensus sees the unemployment rate holding at 4.3%, unchanged from March, supporting the view that prior Fed rate cuts have helped stabilize labor conditions.
Technical Broad-Market Analysis
The S&P 500 has entered an impulsive upside phase, reclaiming its 200-day moving average and decisively clearing 7,000, a level that had capped both prior highs and resistance. Momentum is strong. RSI has moved above 70, confirming buyer dominance, while also flagging near-term overbought conditions after an unusually sharp move. The equal-weighted S&P 500 has not confirmed the breakout, instead pulling back from local highs. Against this backdrop, our base case for the next two weeks is not further vertical upside, but a pause or shallow consolidation. Support has shifted higher into the 6,950–7,000 range, with pullbacks into this zone likely to represent a healthy reset within the broader uptrend. On a medium-term horizon, the next upside targets are 7,300 and 7,400.
Expected Trading Range
For now, we expect the S&P 500 to trade in a 6,950-7,300 range.