
Investment Review №349. High Hopes

Vadim Merkulov
Head of Analytics department
ServiceTitan. A Titan in the Making: Digitizing the Blue-Collar Economy
ServiceTitan stock is worth buying with a target price of $105
About company
ServiceTitan is a rapidly growing SaaS leader fundamentally transforming the skilled trades through a scalable, cloud-native, and deeply integrated platform. The company’s solution unifies key modules — CRM, FSM, ERP, HCM, and FinTech — enabling contractors to automate operations, enhance visibility, and improve business efficiency. It replaces fragmented toolsets across residential and commercial service industries with a single, end-to-end system.
| Ticker | TTAN |
| Share price as of analysis | $80,5 |
| Target share price | $105,0 |
| Growth potential | 30,4% |
| Share price dynamics vs. indices | Day | Week | Month | Quarter | Year |
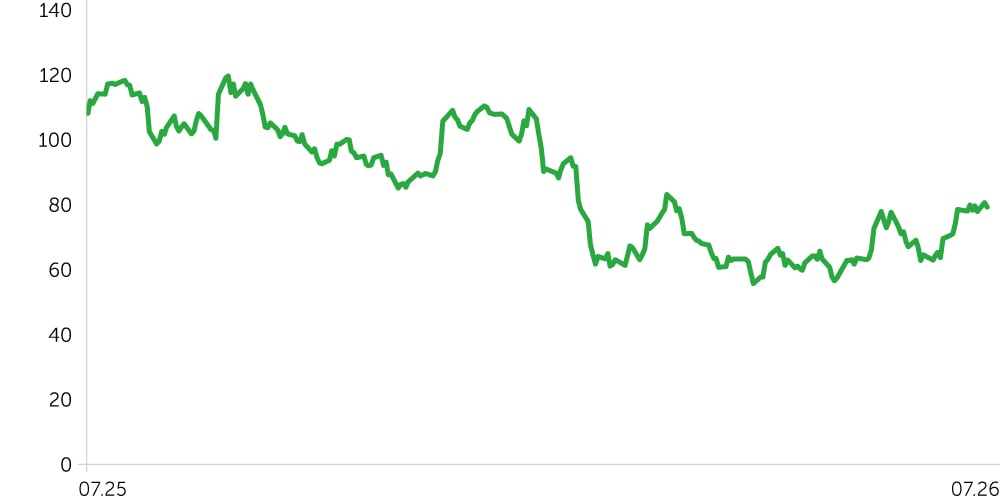
| TTAN | 3,4% | 3,3% | 20,3% | 40,1% | (24,9%) |
| S&P 500 | (0,8%) | (0,3%) | 1,1% | 9,1% | 20,1% |
| Russell 2000 | (0,8%) | (1,9%) | 0,3% | 10,6% | 32,1% |
| DJ Industrial Average | (0,3%) | (1,1%) | 2,5% | 8,9% | 18,3% |
| NASDAQ Composite Index | (1,6%) | (0,9%) | (0,1%) | 11,6% | 25,7% |
Price dynamics TTAN, $
Key Investment Theses
Expanding market opportunity. ServiceTitan operates in a large and fragmented market for skilled trades, estimated at over $1.5 trillion. The company targets a 2% conversion of this opportunity into revenue through platform adoption. As of 2025, its Serviceable Addressable Market (SAM) is estimated at approximately $13 billion, while the Total Addressable Market (TAM) exceeds $30 billion. Key growth drivers include accelerating digitization, industry consolidation, and strategic expansion into new verticals such as landscaping, roofing, and pest control. ServiceTitan continues to broaden its reach through both customer base growth and increased gross transaction volume (GTV) per client. The company’s successful M&A strategy — combined with ongoing investments in R&D, go-to-market, and customer success — underpins its consistent TAM expansion.
The gold standard in the trades. ServiceTitan has established itself as the leading vertical SaaS platform purpose-built for the skilled trades. Deep partnerships with consolidators like Wrench Group, along with integrated AI-powered analytics via Titan Intelligence, position the company as the technology backbone for scaled service operators. The platform is embedded across customers’ workflows and delivers strong retention, upsell, and cross-sell performance.
Significant long-term margin expansion opportunity. Non-GAAP operating margin has already reached 9.8% and should continue to expand by a couple of percentage points per year. Management expects to reach over 25% operating margin in the long term, driven by business scale, a favorable revenue mix shift, and improving customer-acquisition profitability. ServiceTitan has already reached sustainable positive free cash flow on a net cash balance sheet, which — among other things — should support faster expansion into new verticals through its proven bolt-on M&A strategy.
We assign a “Buy” rating on TTAN with a price target of $105, and recommend a stop-loss at $64.
| Ratio Analysis | 2026A | 2027E | 2028E | 2029E | 2030E | 2031E |
| ROE | -10,7% | -6,9% | -4,6% | -2,3% | -0,1% | 1,8% |
| ROA | -9,1% | -6,0% | -4,0% | -2,0% | -0,1% | 1,6% |
| ROCE | -10,0% | -6,7% | -4,5% | -2,3% | -0,1% | 1,8% |
| Sales/Assets (x) | 0,55x | 0,60x | 0,62x | 0,63x | 0,63x | 0,62x |
| Interest Coverage (x) | 13,0x | 799,7x | - | - | - | - |
| Margins, % | 2024A | 2025A | 2026A | 2027E | 2028E | 2029E | 2030E | 2031E |
| Gross margin | 68% | 70% | 74% | 75% | 76% | 76% | 77% | 77% |
| EBITDA margin | 10% | 14% | 18% | 21% | 21% | 22% | 23% | 24% |
| Net Income margin | -4% | 2% | 11% | 12% | 13% | 15% | 16% | 18% |
| Financials, $mln | 2024A | 2025A | 2026A | 2027E | 2028E | 2029E | 2030E | 2031E |
| Revenue | 614 | 772 | 961 | 1 141 | 1 330 | 1 547 | 1 783 | 2 054 |
| Cost of sales | 197 | 229 | 249 | 286 | 325 | 366 | 414 | 468 |
| Gross Profit | 418 | 543 | 711 | 855 | 1 005 | 1 181 | 1 370 | 1 587 |
| OPEX | 435 | 518 | 617 | 708 | 817 | 929 | 1 045 | 1 170 |
| EBITDA | 64 | 105 | 177 | 236 | 283 | 341 | 411 | 499 |
| D&A | 81 | 80 | 83 | 90 | 94 | 90 | 86 | 82 |
| EBIT | -17 | 25 | 94 | 146 | 188 | 252 | 325 | 417 |
| Interest Expenses (Income) | 8 | 7 | -12 | -17 | -22 | -26 | -28 | -29 |
| EBT | -25 | 18 | 106 | 164 | 211 | 277 | 353 | 445 |
| Taxes | 2 | 2 | 4 | 29 | 38 | 50 | 64 | 80 |
| Net Income | -27 | 17 | 102 | 134 | 173 | 228 | 290 | 365 |
| Dilluted EPS | $-0,82 | $0,27 | $1,02 | $1,34 | $1,69 | $2,18 | $2,73 | $3,37 |
| DPS | - | - | - | - | - | - | - | - |