
Investment Review №354. AI lends a hand to the bulls
Market Environment as of September 22
Global Outlook
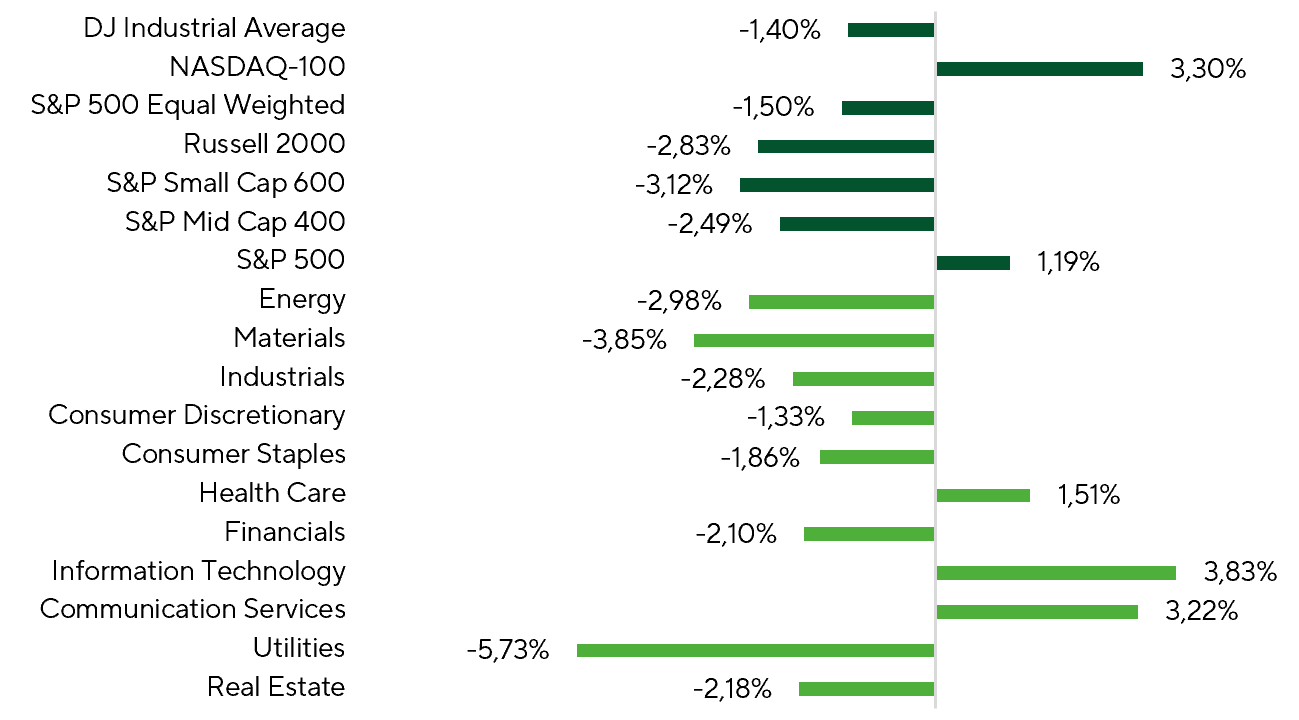
Index and Sector Returns Over the Review Period.
Sources: FactSet, Freedom Broker analysis
Over the review period, major U.S. equity indices moved higher, driven largely by resilience in mega-cap stocks. The move was highly concentrated, with capital rotating out of the broader market and into the largest names. Over the two-week period, the S&P 500 gained 1.19% and the Nasdaq-100 rose 3.30%, while the equal-weighted S&P 500 fell 1.50%. Small- and mid-cap stocks bore the brunt of the pressure.
Market breadth confirms the concentrated-rally thesis: only 28.9% of S&P 500 companies, roughly 145 names, posted positive returns. Among the top 15 companies in the index by market capitalization, however, breadth reached 80%. As a result, the market currently looks fairly fragile. If the positive momentum in the largest technology names fades, risk-off sentiment could quickly take the upper hand.
The sector picture confirms the narrow leadership base. The strongest gains came from Information Technology (+3.83%) and Communication Services (+3.22%), the sectors with the highest concentration of mega-cap names. The laggards included both cyclical areas and rate-sensitive sectors. For rate-sensitive sectors, mainly Utilities and Real Estate, the main negative factor was the Fed’s September rate hike. Higher funding costs are especially material for Utilities, given the sector’s heavy debt loads and ongoing capex needs, while the relative appeal of their dividend yields declines as market rates rise.
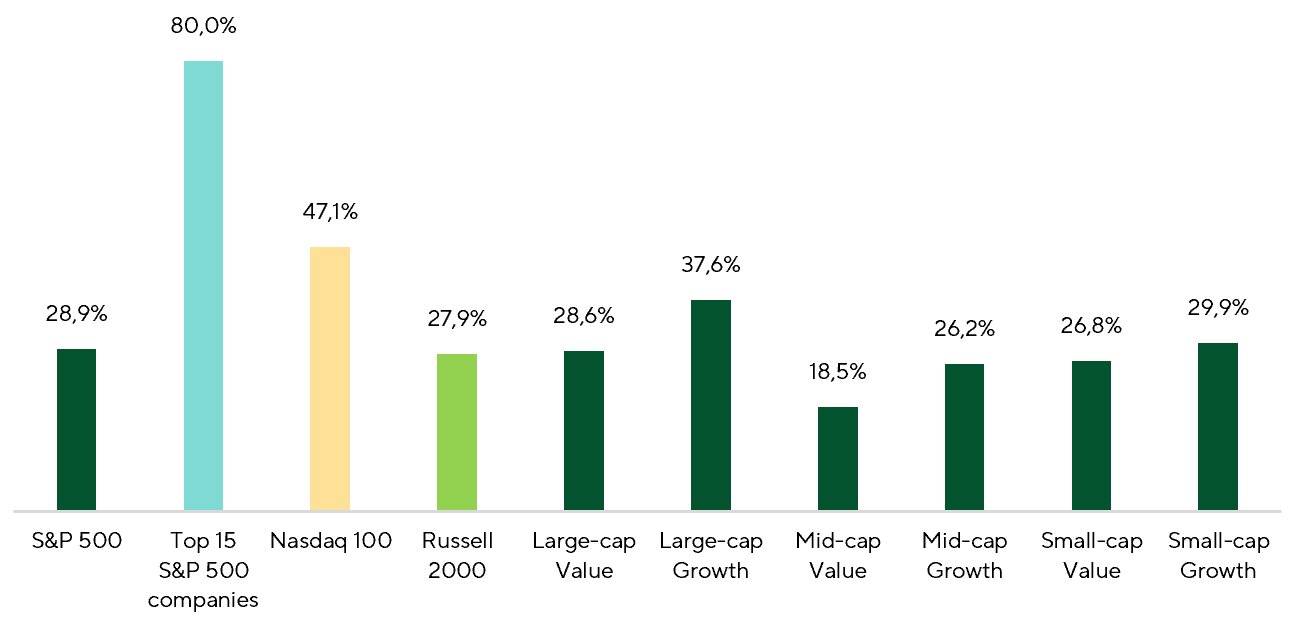
Percentage of Companies with Gains Across Indices Over the Review Period.
Sources: FactSet, Freedom Broker analysis
A further risk for Utilities could come from the debate over a potential slowdown in AI development. In recent weeks, executives at major AI companies and technology groups, including Anthropic, OpenAI, xAI, Google DeepMind, and Microsoft, have publicly backed a more cautious and gradual approach to frontier-model development through stronger independent testing and external oversight. For now, the debate is centered mainly on safety and control rather than any confirmed slowdown in model training or cuts to compute-infrastructure investment. That means the risk has yet to translate into a direct headwind for AI infrastructure. If these statements turn into practical constraints on the pace of AI-model development, however, Utilities tied to accelerating data-center electricity demand could be among the first segments affected.
Beyond IT, Communication Services was another clear leader, with Meta, the index’s largest constituent by weight, driving the move. Over the review period, Meta shares gained almost 21%. The key catalyst was a shift in how investors viewed the company’s AI spending. On September 8, Meta launched Muse, a personal AI agent in the U.S., which quickly gained traction and showed strong early demand. On September 15, Meta followed with Meta One, a subscription service combining paid AI features, creator and business tools, and access to Meta Business Agent. Together, the launches gave investors a clearer path to monetizing Meta’s multibillion-dollar AI investments through subscriptions, business tools, higher engagement and better ad efficiency across its core apps.
Against this backdrop, the consensus forecast for Meta's 2026 earnings growth rose from 9.2% to 11.3%, while 2027 expectations were left unchanged. The repricing reflects stronger near-term market expectations and growing investor confidence that the company's AI spending is starting to translate into tangible financial results. Meta's forward P/E now stands at 23.4x, versus a three-year average of 19.9x. The stock’s next leg will therefore hinge on whether early demand for Muse and new subscription products can convert into durable revenue and earnings growth sufficient to support the premium valuation.
On the macro front, the key event was the September 15–16 FOMC meeting, where the Fed raised the policy rate by 25 bps to 3.75–4.00%, citing the need to bring inflation back to its 2% target more quickly. At the same time, the Fed continues to view the economy as resilient, with consumer spending holding up, capex and productivity improving, and unemployment broadly stable. For the economy and markets, the key takeaway is that the economy could likely absorb another 25–50 bps of tightening without significant damage, while higher rates could support the dollar and help stabilize an otherwise volatile Treasury market. The Fed also leaves the door open to another hike by year-end, although the path beyond that will depend primarily on inflation, oil prices and the trajectory of Treasury yields. Importantly, at least one additional hike by year-end already appears to be priced in: the probability of a hike at the October meeting is approaching 70%, vs. ~30% for a hold.
Historically, tightening cycles over the past ~30 years have rarely been limited to a single rate hike. For investors, the key question is therefore less whether further tightening is coming and more how long the hiking cycle could last and how far the Fed may ultimately need to go. These are the variables currently weighing on equities. Rate futures, which provide a market-based read on policy expectations, imply a base case of up to four additional hikes over the next 12 months.
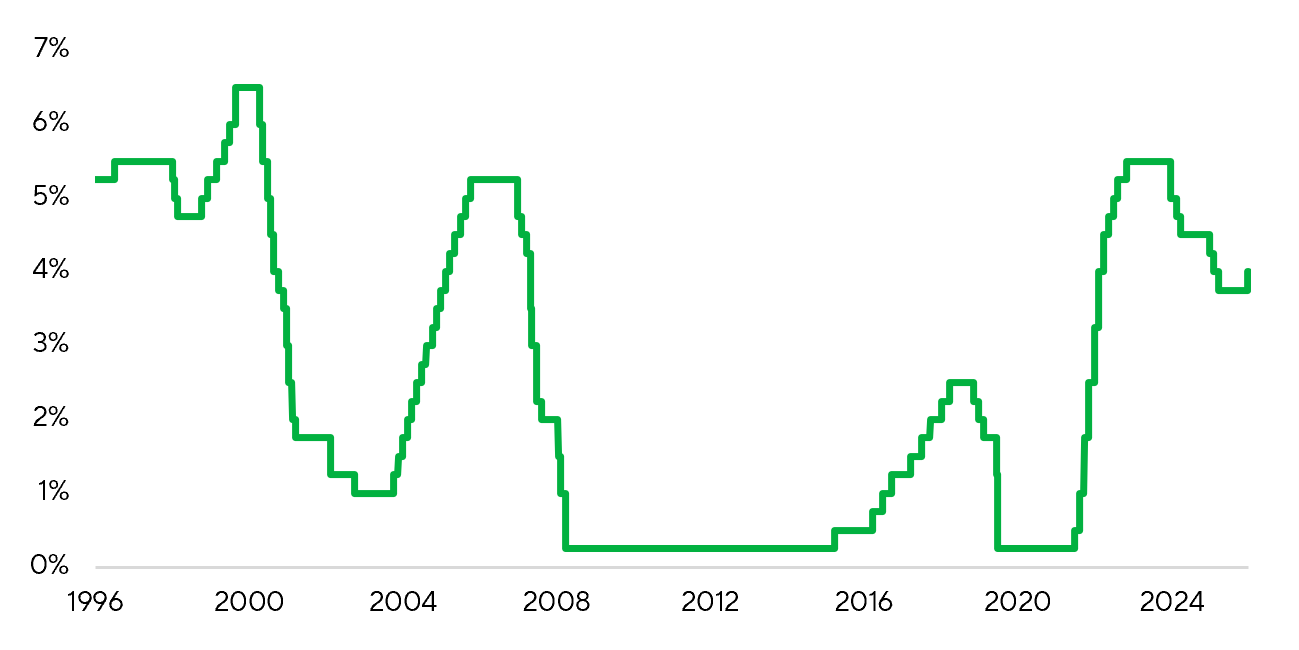
Federal Funds Rate Dynamics
Source: Federal Reserve
Market Focus
In September, oil prices have been significantly influenced by the escalation of the conflict in Yemen. A successful advance by Iran-backed Houthi forces toward the Bab el-Mandeb Strait, and their seizure of islands within it, has substantially tightened their grip on one of the key oil shipping routes. Prices found further support from a strike by pro-Iranian forces based in Iraq on Saudi Arabia's East-West pipeline, which is used to export oil while bypassing the Strait of Hormuz. As a result, WTI crude touched its highest levels in September since May of this year.
A prolonged status quo could send WTI back above $100/bbl, with further escalation opening the door to $110-plus. Markets are watching the trajectory closely, and should elevated prices hold for a meaningful stretch of the month, that alone would likely feed through as upward pressure in the September inflation print.
The corporate earnings season is nearing its end, with 496 index constituents having reported to date. Analysts are flagging several results likely to attract heightened investor interest.
Micron will report fiscal Q4’26 results on September 30. The company enters the print following an exceptional 3Q: revenue rose 346% YoY to $41.5bn, adjusted net income reached $28.9bn versus $2.2bn a year ago, and adjusted EPS surged to $25.11 from $1.91, driven by sharp price increases and tight memory supply amid demand for AI systems. Data Center remained the primary growth engine with revenue above $25bn, while Cloud sales grew 307% YoY to $13.8bn. For Q4, management guides revenue to $50bn ± $1bn, adjusted gross margin of roughly 86%, and EPS of $31 ± $1. Into the print, investors will focus on the durability of DRAM and NAND tightness, the ramp in HBM shipments, and pricing trends. The consensus price target for Micron stands at $1,575.
On October 1, Nike will report results for Q1 FY27. The company enters the release after a weak fourth quarter, with revenue down 1% YoY to $11.0bn, or 4% on a currency-neutral basis. Net income increased to $1.1bn and EPS reached $0.72; however, the improvement was driven largely by an expected tariff refund of $986m, which added roughly $0.52 per share. Key pressure points remain a 7% decline in Nike Direct revenue, a 12% drop in digital sales, and continued weakness in China, where revenue fell 12%. By contrast, wholesale revenue grew 4%, and North America sales rose 3%, suggesting early signs of stabilization. Investors will monitor direct sales recovery, demand trends in China, inventory normalization, and execution against the company’s product refresh strategy. The consensus price target for Nike shares is $47.
Broad Market Technical Setup
The S&P 500 has rebounded to 7,765 and is trading again above its 20- and 50-day moving averages near 7,670 and 7,620, respectively. The RSI has climbed to roughly 60, signaling improving momentum without overbought conditions. Breadth remains narrow, however, with only about 30% of constituents above their 50-day moving averages, limiting the scope for sustained upside and keeping volatility risk elevated. Our two-week risk balance is moderately constructive. A sustained break above the August high around 7,820 would open a path toward 7,900, while the 7,600–7,620 area remains key support, coinciding with the 50-day moving average. As long as that area holds, we expect a 7,600–7,900 trading range.
Expected Trading Range
In our view, the S&P 500 will be trading between 7.600 and 7.900.