Markets Hit Record Highs. Investment Review №325
Review as of July 29
Global Perspective
Since mid-July, the S&P 500 has advanced by 1.9%, while the Dow Jones and NASDAQ 100 indices have risen 0.9% and 2.2%, respectively. Although attempts to sustain the rally in early July initially showed promise, the momentum shifted downward in the latter half of the month, with gains predominantly concentrated among the top ten companies, particularly in the IT sector. This sector's strength was notably underpinned by the outstanding performance of NVIDIA (NVDA) shares. In addition to this, pro-cyclical sectors such as Materials and Consumer Discretionary witnessed positive and excess returns. Small and mid-cap equity segments underperformed relative to the broader market index, primarily due to the base effect following a robust start in early July. Furthermore, strong business activity has diminished expectations for any imminent monetary policy easing.
2 Week Performance and Excess Return
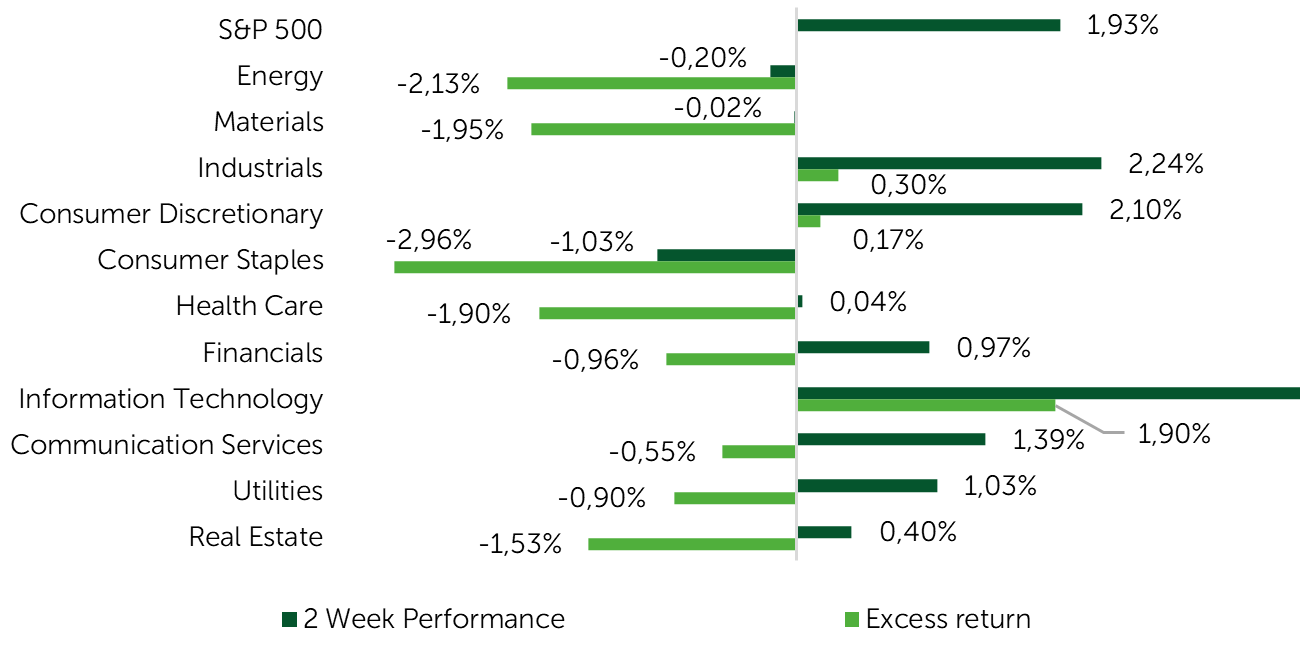
Source: FactSet, Freedom Broker
In the absence of unforeseen developments, it appears that the Trump administration has made notable strides in reshaping global trade structures to its advantage (or so Trump's narrative suggests). Over the past fortnight, the United States has successfully negotiated new trade frameworks with several countries, including Indonesia, the Philippines, Japan, and, most critically, the European Union. These negotiations have resulted in a reduction in import tariffs: 19% for both Indonesia and the Philippines, 15% for Japan, and the EU. Such developments have contributed to sustaining bullish sentiment in the market.
While these agreements are currently preliminary, they set the stage for further discussions that are expected to have minimal impact on the broader narrative. However, any significant deviation from the current framework is unlikely. The finalized agreements may also include various exceptions, potentially leading to a reduced weighted average tariff rate. Beyond the transparent component of the import tariffs, these deals also entail commitments to increase the purchase of U.S. goods and investments in the United States—$550 billion from Japan and $600 billion from the EU. Considering past U.S. experiences with analogous agreements with China, the feasibility of implementing these provisions remains uncertain. Moreover, the implications for U.S. trading partners in the event of non-compliance with these terms have yet to be determined.
With the U.S. currently having tentative agreements in place with most of its major trading partners—except Canada and Mexico—the risk associated with tariffs is poised to recede into the background. Investors, however, will shift their attention to the actual pass-through of tariffs to end consumers and the sustainability of inflationary pressures. As illustrated in the accompanying Chart, the average tariff as of July 29 has climbed to over 14%, while the average impact of tariff adjustments on consumer spending is approximately 2% compared to 2024.
Variations in Average U.S. Import Tariffs
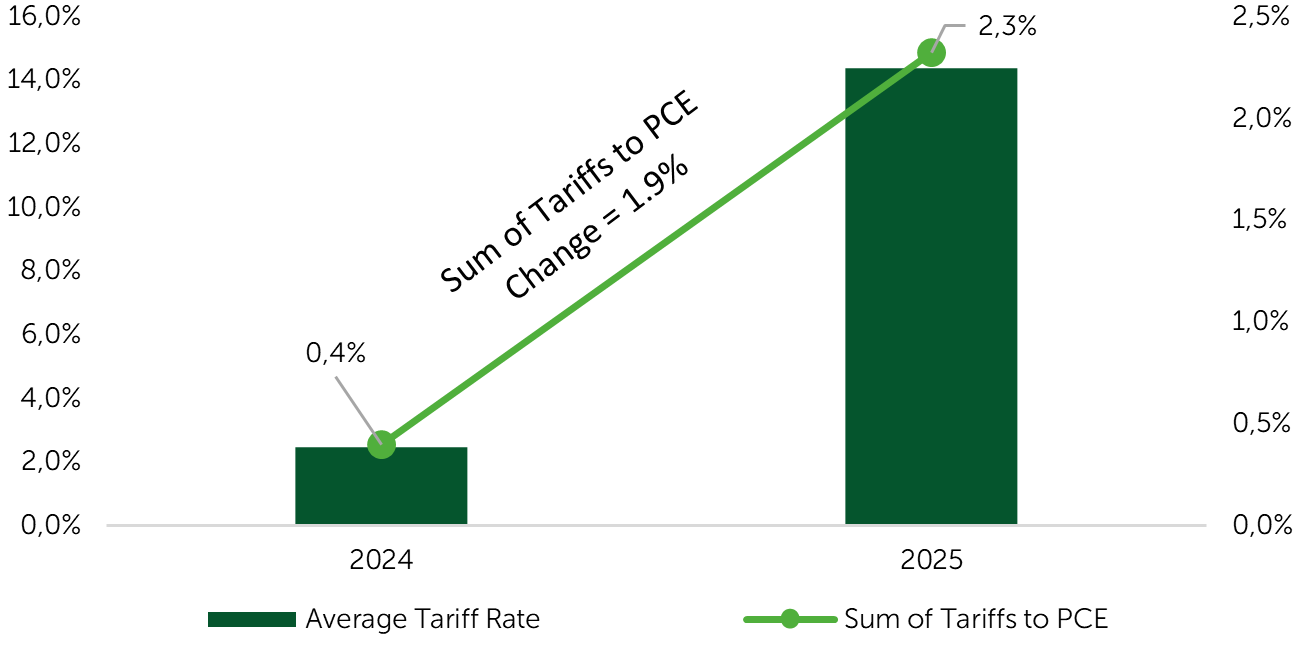
Source: taxfoundation.org, bea.gov, Freedom Broker. *2025 – Status as of July 29
Another essential variable bolstering market growth was the macroeconomic component. Data from the University of Michigan indicated an improvement in consumer sentiment in July, rising to 61.8 points from 60.7 points previously. Consumer expectations also exceeded forecasts, reaching 58.6 points compared to the anticipated 55 points. Additionally, retail sales increased by 0.6% m/m in June, surpassing the expected growth of 0.1% m/m, while the benchmark group experienced a 0.5% m/m rise against a forecasted 0.3% m/m growth. Business sentiment showed general improvement, with July PMI data from S&P Global reporting the service sector at 55.2 points, beating the expected 53 points. The labor market remained resilient, as evidenced by the latest jobless claims data, which declined to 217,000.
The earnings season added further momentum, with 46% of companies announcing positive EPS surprises, and about 80% exceeding EPS estimates. The average EPS surprise reached approximately 6%. Expectations for EPS growth have been revised upward for 2025 and 2026 to +8.9% and 13.8% y/y, respectively, compared to previous estimates of +8.5% and 13.6% as of June 30.
Market Focus
With the threat of tariffs appearing to have significantly diminished, investors' attention over the next ten days is set to shift predominantly toward the earnings season, with particular emphasis on the performance of major corporations. Sustained robust momentum, alongside elevated forecasts for the coming quarter and overall year, has the potential to bolster bullish market sentiment. Additionally, a strong earnings season, on the whole, could potentially sustain the rally, which, as previously noted, has experienced a temporary pause over the last fortnight.
The macroeconomic calendar for the upcoming week and a half is expected to be relatively sparse. The focal point for market participants will be the consumer inflation data for July, slated for release on August 12. This dataset is anticipated to be among the most pivotal for the market in the near term, as it will enable investors to evaluate the actual impact of tariffs on price levels. Given that June's inflation figure was subdued, a similar reading for July could bolster market confidence in the transitory nature of current inflationary pressures. Such an outcome could further support the expectation of additional rate cuts by the Federal Reserve in the ensuing months. This potential policy shift may provide considerable support to rate-sensitive areas like like durable goods, real estate, developers, and the broader spectrum of small and medium-cap companies.
While the market shows some signs of being overbought in the short term, a comprehensive set of indicators suggests we are far from a euphoric state that would signal a major reversal. The latest AAII survey reveals that net bullish exposure among retail investors is still modest at +3.8%. A similar sentiment echoes among professional portfolio managers. For instance, the July survey conducted by Bank of America (BofA) indicates that global portfolio managers' allocation to U.S. equities stood at -23%, an improvement from -36% in June, suggesting room for further gains. In the medium term, we maintain a neutral market outlook, supported by relatively stable economic activity and a resilient labor market.
Small-Cap Stocks
At the conclusion of the two-week period, the previously noted expansion of the market rally came to a halt. The Russell 2000 Index (ETF: IWM) experienced a modest gain of 0.4%, trailing behind the larger companies within the S&P 500, which itself advanced by 1.9%. In the small-cap equity segment, micro-cap issuers demonstrated the most significant growth, with the Russell Microcap Index (ETF: IWC) climbing 1.4%. Among key benchmarks, the S&P Small Cap 600 (ETF: IJR) was the outlier, concluding the period with a slight decline of 0.3%.
Since mid-July, the expansion of the market rally has stalled, yet a noteworthy shift has emerged among market participants. Following the drawdown in April and the subsequent rebound—underpinned by a renewed appetite for risk—focus has increasingly turned towards micro-cap and loss-making issuers, particularly those with a strong growth bias. This shift is evidenced by heightened trading activity, prompting volatile swings in stock prices. The Russell Microcap Index has notably outperformed, beating the Russell 2000 and the S&P Small Cap 600 by 7.7% and 11.0%, respectively, since the rally's inception in April, and by 2.0% and 2.6% since early July. Furthermore, the increased risk inclination can be observed in the performance of the Goldman Sachs Non-Profitable Tech Index, which has surged 65.6% from its April low. Consequently, the broader market continues to largely disregard macroeconomic risks. Despite signs of overheating in certain market segments, the ongoing market momentum suggests that further rally expansion might be on the horizon in the short term.
As of July 31, an analysis of the interim results for this earnings season reveals that 230 companies within the S&P Small Cap 600, representing approximately 38% of the index, have released their earnings reports. Notably, a significant portion of these reports come from regional banks and financial companies, which constitute 90 of the 230 reporting firms. This sector has demonstrated encouraging performance, with a collective EPS increase of 7.9% compared to the same period in the previous year. This growth can be attributed to factors such as ongoing discussions around banking deregulation, a resurgence in lending activities, normalization in the cost of risk, and sustained capital market activities. In light of this landscape, market analysts have revised their forecasts regarding the KRE Regional Banks Index ETF (KRE ETF) upward. According to FactSet data, the one-year price target for the ETF is now pegged at $70.3, indicating a potential 15.6% increase from its current level. With the earnings season for small-cap companies continuing, investor attention is set to remain fixed on forthcoming reports. Expectations are high as an additional 231 companies from the S&P Small Cap 600 Index and 719 companies from the Russell 2000 are scheduled to disclose their earnings over the next week and a half.
Broad Market Technical Analysis
The medium-term technical outlook for the S&P 500 Index remains robust. In the short term, however, the index faces a potential setback as the RSI has entered the overbought territory, surpassing 70 points. This development may prompt a healthy market correction. Nonetheless, the proportion of companies with an RSI above 70, as well as those trading above their 50-day moving average, is not yet at levels that typically signal a widespread overbought condition. This suggests that any impending correction might be shallow, paving the way for the market to resume its upward trajectory.
Expected Trading Range
We expect the S&P 500 Index to move in the range between 6,300–6,500 points.