Markets Hit Record Highs. Investment Review №325

Vadim Merkulov
Head of Analytics department
Realty Income. The Gold Standard of Stability
REIT Realty Income shares present a buy opportunity with a target price of $63.5
About Company
Realty Income (O) manages properties in a defensive retail real estate sector, focusing on essential consumer tenants that are in high demand regardless of the economic cycle. Property occupancy has remained at peak levels for several consecutive years, and the portfolio is gradually transitioning to CPI-linked leases, offering inflation protection. This strategic focus has allowed the company to significantly expand its property portfolio on favorable terms, providing investors with an attractive, stable monthly dividend yield.
| Ticker | O |
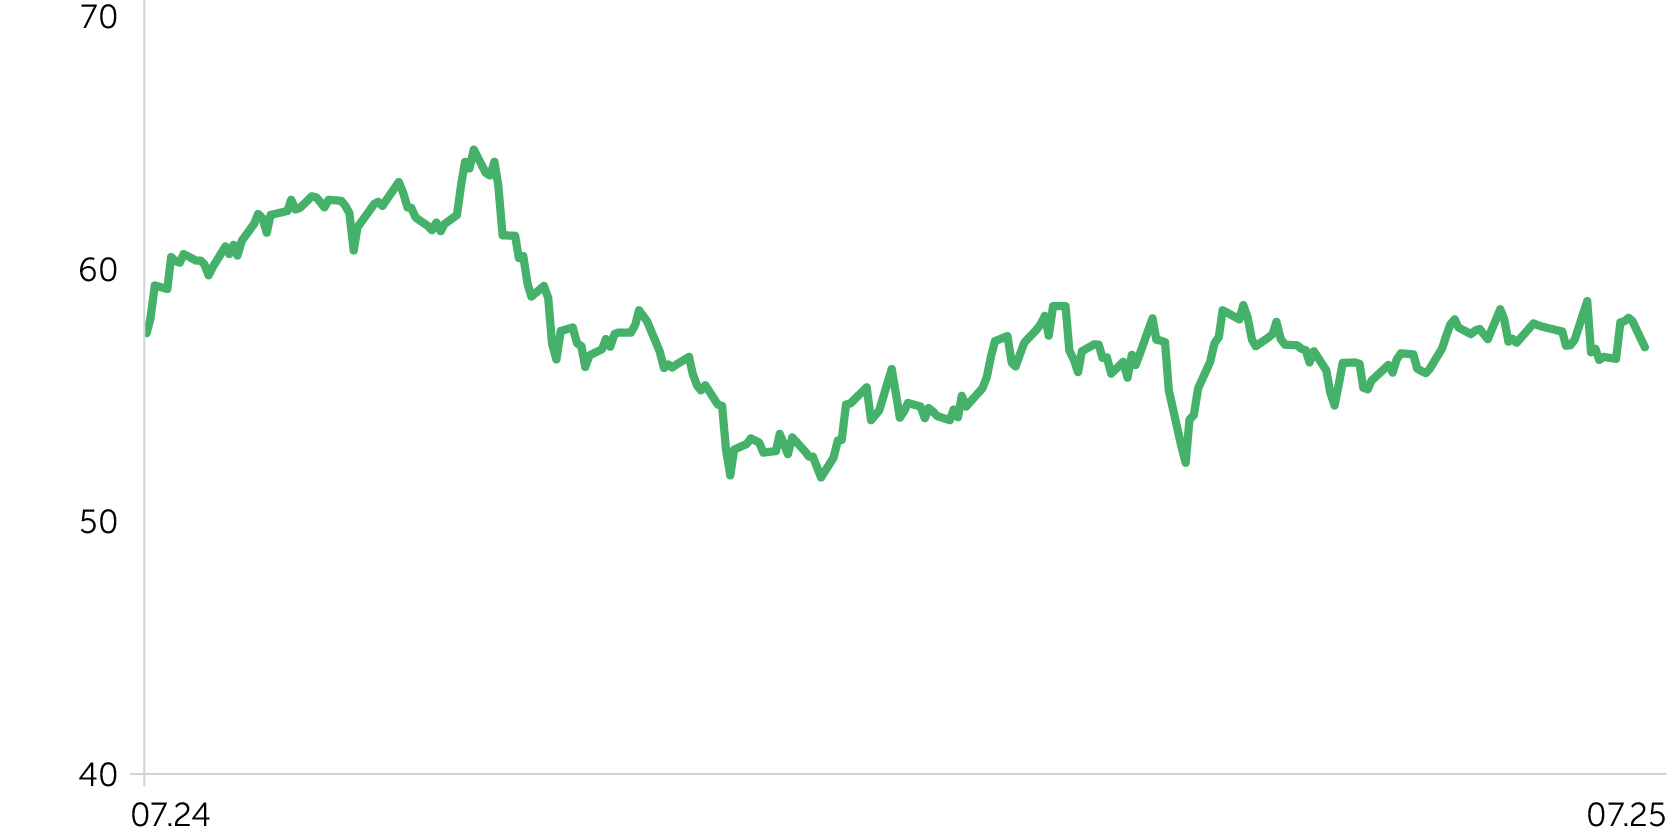
| Share price as of analysis | $56,86 |
| Target share price | $63,50 |
| Growth potential | 10,6% |
| Stock vs Indices | Day | Week | Month | Quarter | Year |
| O | (1,8%) | 0,8% | (0,3%) | (0,7%) | (2,1%) |
| S&P 500 | 0,0% | 1,3% | 3,5% | 15,6% | 17,0% |
| Russell 2000 | (0,2%) | 1,1% | 3,9% | 14,8% | (0,1%) |
| DJ Industrial Average | (0,1%) | 1,2% | 2,3% | 11,5% | 10,5% |
| NASDAQ Composite Index | 0,3% | 1,0% | 4,5% | 22,0% | 22,0% |
Price dynamics O, $
Investment Thesis
- Realty Income’s strategic expansion into Europe represents a key growth driver over a 5–10 year horizon. The company is entering a less competitive market, estimated at approximately $8.5 trillion and currently served by only two public players in the net lease segment. In 1Q25, $893 million was deployed in Europe (around 63% of total investments) at an initial yield of 7.0%, underscoring the effectiveness of the strategy. An additional growth catalyst is the favorable euro-denominated borrowing environment, which enhances transaction economics and amplifies the leverage effect.
- Defensive portfolio focused on resilient sectors of the economy. Core industries such as grocery stores (10.3% of annual base rent – ABR), convenience stores (9.9%), discount retailers (6.3%), home improvement stores (6.3%), and pharmacies (4.6%) form the backbone of the portfolio. As a result, according to the company’s estimates, 91% of rental income is derived from tenants that are resistant to economic downturns and the impact of e-commerce. For investors, this translates into exceptional cash flow predictability, forming the foundation for the company’s reliable and growing monthly dividends.
- Realty Income demonstrates strong tenant management efficiency. The overall re-leasing spread on 194 renewed or re-leased contracts reached 103.9%, generating over $46 million in new annual rental income. A significant portion of leasing activity (92%) was driven by renewals with existing tenants, indicating that in-place rents are below market levels and that demand for the company’s properties remains robust.
- The company offers an attractive combination of value and yield while maintaining its position as a recognized leader in the net lease segment. Despite the scale of the company’s operations and the quality of its assets, the stock is trading at a discount based on forward multiples, with an implied cap rate of 6.4%, compared to its historical average of 5.14% and in line with peers at 6.4%. The stock is trading at 13.1x P/core FFO (vs. 13.7x for peers) and 13.2x P/AFFO (vs. 14.5x). Realty Income also delivers a monthly (increasing effective annual return) dividend yield of 5.6%, materially above the peer average of 4.73%. This combination of resilient income, discounted valuation, and sector leadership makes the stock compelling both for investors seeking stable cash flow and those looking for a defensive asset with upside potential.
We set a target price for O at $63 with a “Buy” recommendation. A stop-loss is advised at the $52.8 level.
| Marginality % | 2023A | 2024A | 2025E | 2026E | 2027E | 2028E | 2029E | 2030E |
| Gross margin | 92% | 93% | 92% | 93% | 93% | 93% | 93% | 93% |
| EBITDA Non-GAAP (non-adj) margin | 87% | 82% | 85% | 84% | 84% | 84% | 84% | 84% |
| Net Income margin | 21% | 16% | 23% | 16% | 16% | 16% | 16% | 16% |
| Ratio Analysis | 2023A | 2024A | 2025E | 2026E | 2027E | 2028E | 2029E | 2030E |
| ROE | 2,8% | 2,4% | 3,2% | 2,0% | 1,9% | 2,0% | 2,1% | 2,0% |
| ROA | 1,6% | 1,4% | 1,8% | 1,1% | 1,1% | 1,2% | 1,2% | 1,1% |
| ROCE | 3,3% | 3,3% | 3,6% | 2,6% | 2,5% | 2,7% | 2,8% | 2,7% |
| Sales/Assets (x) | 0,08x | 0,08x | 0,08x | 0,07x | 0,07x | 0,07x | 0,07x | 0,07x |
| Interest Coverage (x) | 2,3x | 1,9x | 2,3x | 2,0x | 1,9x | 1,9x | 1,9x | 1,92x |
| Financial performance, $ mn | 2023A | 2024A | 2025E | 2026E | 2027E | 2028E | 2029E | 2030E |
| Revenue | 4 079 | 5 271 | 5 631 | 5 424 | 5 658 | 6 583 | 6 969 | 7 151 |
| Cost of sales | -317 | -378 | -424 | -402 | -419 | -487 | -515 | -529 |
| Gross Income | 3 762 | 4 893 | 5 208 | 5 022 | 5 239 | 6 096 | 6 454 | 6 623 |
| SG&A | -145 | -177 | -189 | -183 | -191 | -222 | -235 | -241 |
| EBITDA Non-GAAP (non-adj) | 3 555 | 4 346 | 4 784 | 4 544 | 4 773 | 5 534 | 5 870 | 6 018 |
| Depreciation and Amortization | -1 895 | -2 396 | -2 352 | -2 590 | -2 761 | -3 212 | -3 401 | -3 490 |
| EBIT Non-GAAP (non-adj) | 1 659 | 1 951 | 2 432 | 1 955 | 2 012 | 2 322 | 2 469 | 2 528 |
| Interest Expenses | -730 | -1 017 | -1 059 | -1 002 | -1 044 | -1 213 | -1 285 | -1 318 |
| EBT | 929 | 934 | 1 374 | 953 | 968 | 1 108 | 1 184 | 1 209 |
| Taxes | -52 | -67 | -87 | -61 | -62 | -71 | -75 | -77 |
| Net Income GAAP | 877 | 867 | 1 286 | 892 | 907 | 1 038 | 1 108 | 1 132 |
| Diluted EPS GAAP | $1,26 | $0,98 | $1,11 | $1,00 | $0,97 | $1,05 | $1,04 | $0,99 |
| DPS | $3,05 | $3,13 | $3,19 | $2,84 | $2,70 | $2,90 | $2,86 | $2,74 |