Investment Review №332. The Bulls switched to big tech

Vadim Merkulov
Head of Analytics department
Unitil Corporation. Stability. Growth. Dividends
UTL shares are attractive for purchase with a target price of $55
About company
Unitil Corporation (UTL) is a key regulated utility operator in New England, engaged in the design, operation, and development of electricity and natural gas distribution networks serving over 198,тыс. customers across New Hampshire, Massachusetts, and Maine. The company serves a wide range of consumers - from households and small businesses to industrial clients and implements large-scale infrastructure projects aimed at modernizing its networks and expanding its customer base, including strategic acquisitions in new regions and service segments. Unitil’s corporate headquarters is located in Hampton, New Hampshire.
| Ticker | UTL |
| Share price as of analysis | $48,74 |
| Target share price | $55 |
| Growth potential | 12,84% |
| Share price dynamics vs. indices | Day | Week | Month | Quarter | Year |
| UTL | (1,4%) | (1,6%) | 3,6% | (6,7%) | (14,1%) |
| S&P 500 | (0,1%) | (2,0%) | 0,7% | 7,3% | 18,5% |
| Russell 2000 | (0,4%) | (3,2%) | (2,4%) | 10,8% | 9,4% |
| DJ Industrial Average | 0,1% | (1,9%) | 1,2% | 7,6% | 12,7% |
| NASDAQ Composite Index | (0,5%) | (2,0%) | 2,1% | 11,2% | 28,4% |
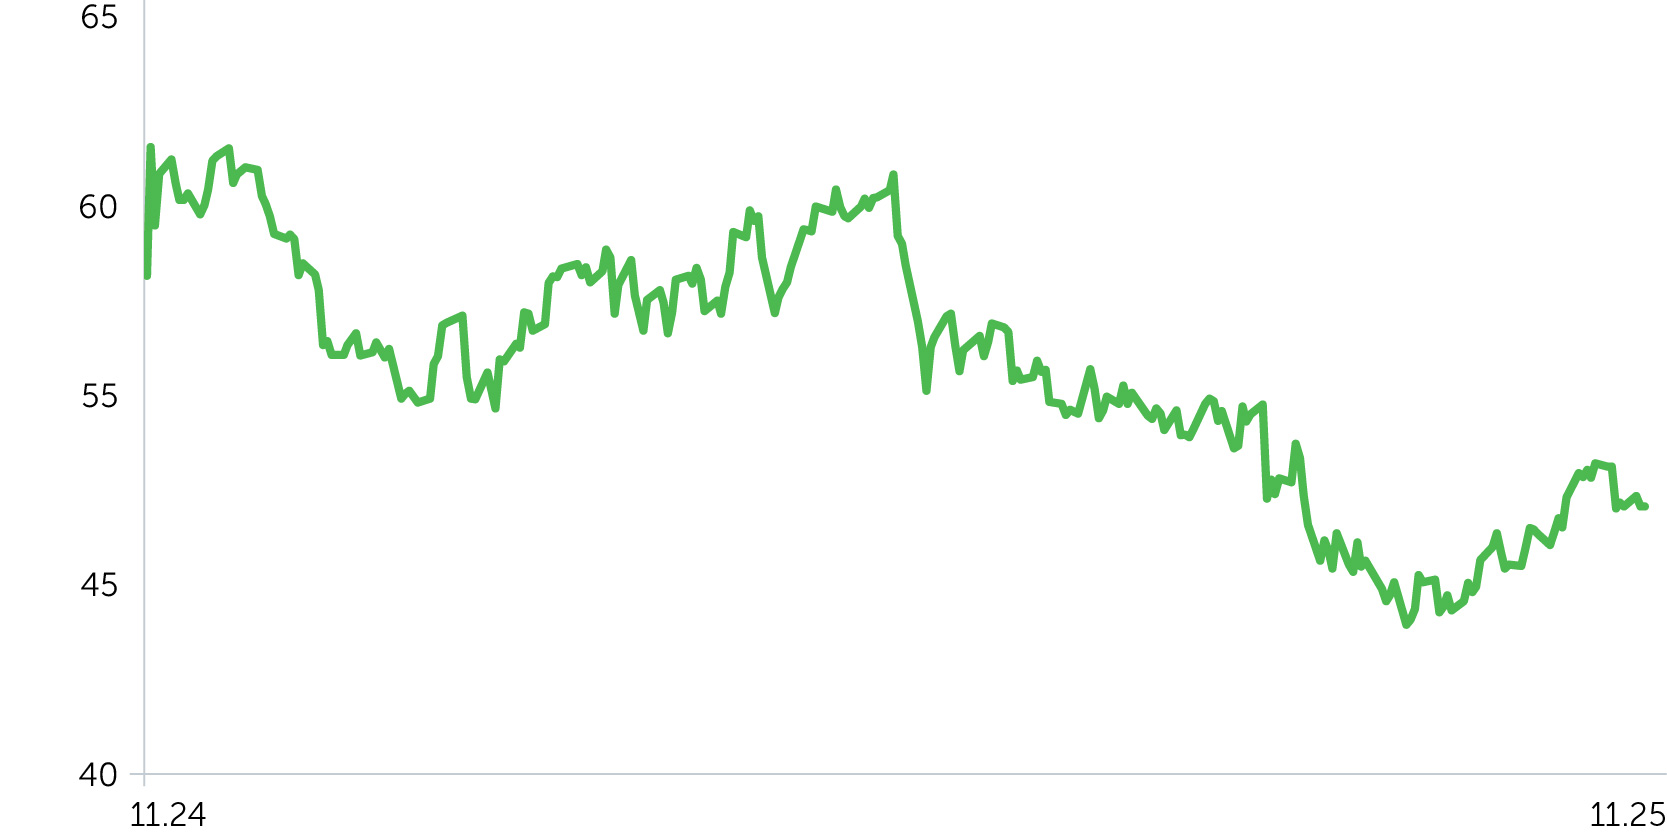
Price dynamics UTL, $
Key Investment Theses
- Strategic acquisitions expand the company’s scale. In 2025, Unitil completed and fully integrated the Bangor Natural Gas and Maine Natural Gas acquisitions, adding roughly 15,тыс. customers and $140 million to the company’s rate base. Additionally, in November, Unitil received approval for the acquisition of three Aquarion Water companies, marking its entry into the water utility segment with an additional 23,тыс. customers and more than $85 million in rate base. Following integration in 2025, the company’s total customer base increases to approximately 236,тыс., while its consolidated rate base rises by over $220 million. According to updated management guidance, the rate base is expected to grow at 10% annually from 2025 onward, driven by both organic expansion and new acquisitions. The transactions were executed at multiples comparable to the best deals in the sector, positively impacting long-term returns.
- Supportive regulatory environment. Unitil operates in states with constructive regulatory frameworks (New Hampshire, Massachusetts, and Maine), which provide mechanisms for timely capital cost recovery, capital trackers, and revenue decoupling to protect earnings from volumetric fluctuations. These factors minimize profit volatility and support steady investment levels. In 2025, the state of Maine also passed a Fuel Choice Act, expanding opportunities for the natural gas segment.
- Accelerated growth and robust investment program. Management reaffirmed guidance for EPS growth of 5 - 7% annually and rate base growth of 10% per year incorporating the newly integrated assets. The capital expenditure plan was increased to $1 billion for 2025 - 2029, with investments focused on system modernization, grid upgrades, energy transition initiatives, and new business segments such as water utilities. To finance this plan, Unitil raised $74.8 million in 2025 through a follow-on equity offering.
- Reliable and growing dividend. Unitil demonstrates strong financial discipline and shareholder commitment, making its dividend profile one of the most solid in the utility sector. The recent announcement of a quarterly dividend increase to $0.45 per share (annualized $1.80) represents a 5.9% year-over-year growth, continuing the company’s long-standing tradition of consistent dividend hikes. This increase is supported by a resilient business model and a conservative payout ratio of around 60%, ensuring dividend safety and room for future growth.
The target price for UTL shares is $55, with a “Buy” recommendation. A stop-loss order is advisable at $45,6.
| Margins, % | 2022А | 2023А | 2024А | 2025E | 2026E | 2027E | 2028E | 2029E | 2030E |
| Gross margin | 14% | 16% | 18% | 19% | 19% | 19% | 20% | 20% | 21% |
| EBITDA margin | 25% | 28% | 34% | 36% | 37% | 38% | 39% | 39% | 40% |
| Net profit margin | 7% | 8% | 9% | 9% | 10% | 10% | 10% | 11% | 11% |
| Ratio Analysis | 2024А | 2025E | 2026E | 2027E | 2028E | 2029E | 2030E |
| ROE | 9% | 8% | 8% | 9% | 9% | 9% | 9% |
| ROA | 3% | 2% | 3% | 3% | 3% | 3% | 3% |
| ROCE | 6% | 6% | 6% | 6% | 6% | 6% | 6% |
| Sales/Assets | 0,28x | 0,26x | 0,25x | 0,25x | 0,25x | 0,25x | 0,25x |
| Interest Coverage | 3,09x | 2,74x | 2,99x | 3,06x | 3,09x | 3,07x | 3,08x |
| Financials, $mln | 2022А | 2023А | 2024А | 2025E | 2026E | 2027E | 2028E | 2029E | 2030E |
| Revenue | 563 | 557 | 495 | 517 | 530 | 559 | 580 | 607 | 614 |
| Operating Expenses | 483 | 470 | 404 | 419 | 429 | 452 | 466 | 484 | 488 |
| Operating Income | 81 | 87 | 91 | 99 | 101 | 108 | 114 | 123 | 127 |
| EBITDA, non-adj. | 143 | 155 | 167 | 188 | 197 | 213 | 225 | 239 | 243 |
| D&A | 63 | 67 | 79 | 89 | 95 | 106 | 111 | 116 | 117 |
| Net interest | 26 | 29 | 29 | 36 | 34 | 35 | 37 | 40 | 41 |
| EBT, non-adj. | 53 | 58 | 61 | 64 | 67 | 72 | 77 | 83 | 86 |
| Tax | 11 | 13 | 14 | 15 | 15 | 17 | 18 | 19 | 20 |
| Net Income, non-adj. | 41 | 45 | 47 | 49 | 52 | 56 | 60 | 64 | 66 |
| DPS | $1,57 | $1,64 | $1,71 | $1,79 | $1,80 | $1,94 | $2,07 | $2,21 | $2,28 |