Investment Review №337. A shift toward hedging

Vadim Merkulov
Head of Analytics department
Frequency Electronics. A defensive strategy
FEIM shares are attractive for purchase with a target price of $64.
About company
Frequency Electronics, Inc. (FEIM). Frequency Electronics, Inc. (FEIM) develops and manufactures high-precision synchronization and navigation products for space and ground-based systems, with a primary focus on the U.S. market. The company works with major defense contractors including Lockheed Martin, BAE Systems, and Northrop Grumman, who integrate FEIM's solutions into their systems.
| Ticker | FEIM |
| Share price as of analysis | $56,01 |
| Target share price | $64 |
| Growth potential | 14,3% |
| Share price dynamics vs. indices | Day | Week | Month | Quarter | Year |
| FEIM | 7,8% | (0,3%) | (0,5%) | 49,5% | 226,6% |
| S&P 500 | 0,4% | 2,7% | 0,7% | 2,8% | 16,1% |
| Russell 2000 | 0,3% | 0,8% | 5,2% | 6,1% | 16,8% |
| DJ Industrial Average | (0,8%) | 1,1% | 0,6% | 3,8% | 9,6% |
| NASDAQ Composite Index | 0,9% | 3,8% | 0,9% | 2,6% | 23,1% |
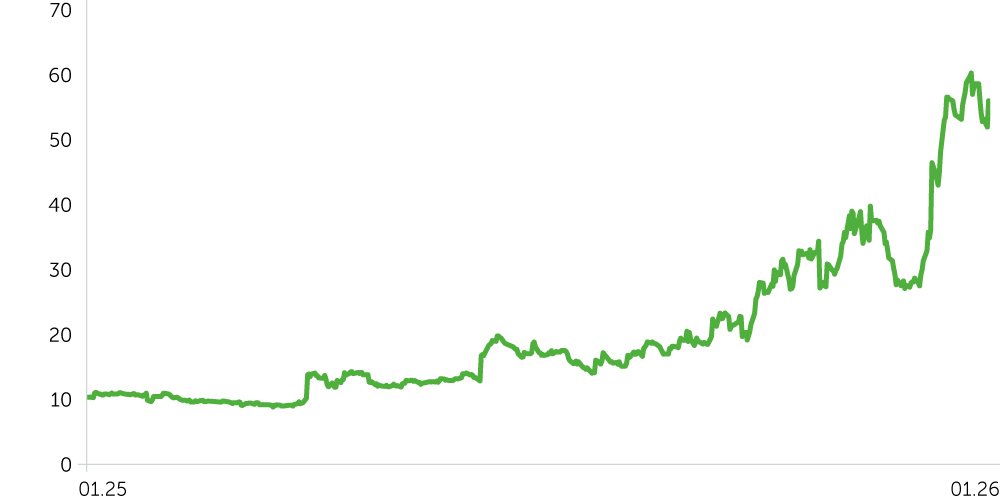
Price dynamics FEIM, $
Key Investment Theses
Political support for defense: Recent U.S. government initiatives provide a strong backdrop for defense contractors. Notably, President Donald Trump has called for raising the national defense budget to $1.5 trillion by 2027—nearly 50% higher than current levels—aiming to build a “dream military” amid rising global tensions. These announcements have already lifted investor sentiment, with shares of major defense companies moving higher. For specialized suppliers like FEIM, this creates opportunities for new contracts, as large integrators
look to ramp up production and secure reliable component suppliers to meet tighter timelines and higher demand.
New space programs (Tranche 3 by SDA): The ongoing "satellite revolution" in defense is a major growth driver for FEIM. The Space Development Agency (SDA) recently announced ~$3.5 billion in contracts to build 72 new tracking satellites (Tracking Layer Tranche 3), which will expand the U.S. missile warning and defense satellite constellation. Scheduled for launch in fiscal year 2029, this system will significantly improve global coverage and tracking of advanced threats, including hypersonic missiles. Crucially, this architecture relies on ultra-precise timing. As a leader in highly reliable time and frequency solutions, FEIM stands to benefit directly—its oscillators and atomic clocks are essential building blocks for such systems.
Quantum technology investments: FEIM is also expanding into quantum technologies and has opened a new engineering center in Boulder, Colorado. Management expects the Boulder operations to become profitable by the third quarter of fiscal year 2026, as its experts are already participating in externally funded R&D programs.
Record-high backlog: The rising demand from the defense sector is reflected in FEIM’s order backlog, which reached a record $82 million as of the end of October 2025. Management expects this to exceed $100 million in the coming quarters. This provides solid visibility into future revenues and confirms FEIM’s strong position in key defense supply chains.
We believe FEIM shares have about 15% upside in the medium term. Our 12-month price target is $64, with a “Buy” recommendation. A suggested stop-loss level is $49.
| Ratio Analysis | 2023A | 2024A | 2025A | 2026E | 2027E | 2028E | 2029E | 2030E |
| ROE | -14% | 15% | 50% | 16% | 19% | 20% | 18% | 16% |
| ROA | -6% | 6% | 25% | 10% | 11% | 11% | 11% | 10% |
| ROCE | -9% | 11% | 18% | 15% | 19% | 22% | 20% | 19% |
| Sales/Assets (x) | 0,5x | 0,6x | 0,7x | 0,8x | 0,8x | 0,8x | 0,7x | 0,7x |
| Interest Coverage (x) | -30,0x | 46,1x | 112,8x | 106,8x | 231,7x | 282,3x | 321,7x | 353,9x |
| Margins, % | 2023A | 2024A | 2025A | 2026E | 2027E | 2028E | 2029E | 2030E |
| Gross Margin | 19% | 34% | 43% | 40% | 41% | 42% | 43% | 44% |
| EBITDA Margin | (5%) | 14% | 21% | 18% | 20% | 21% | 22% | 23% |
| Net Margin | (11%) | 10% | 18% | 14% | 15% | 15% | 16% | 17% |
| Financials, $ mln | 2023A | 2024A | 2025A | 2026E | 2027E | 2028E | 2029E | 2030E |
| Revenue | 40 777 | 55 274 | 69 811 | 80 199 | 96 505 | 111 279 | 120 364 | 125 999 |
| COGS | 32 928 | 36 691 | 39 714 | 48 148 | 56 972 | 64 581 | 68 650 | 70 604 |
| Gross Income (adj.) | 7 849 | 18 583 | 30 097 | 32 051 | 39 533 | 46 698 | 51 714 | 55 395 |
| SG&A | 9 372 | 10 184 | 12 289 | 15 904 | 17 781 | 20 503 | 22 177 | 23 215 |
| R&D | 3 149 | 3 380 | 6 076 | 5 781 | 6 956 | 8 021 | 8 676 | 9 082 |
| EBITDA (adj.) | (2 041) | 7 965 | 14 948 | 14 650 | 19 214 | 23 345 | 26 634 | 29 349 |
| D&A | 2 434 | 2 124 | 2 055 | 2 436 | 2 194 | 2 606 | 2 998 | 3 347 |
| Interest expense (income) | (156) | (109) | (104) | (114) | (73) | (73) | (73) | (73) |
| Other income (expense) | (599) | 554 | 516 | 938 | 873 | 1 006 | 1 088 | 1 139 |
| Pretax Income (adj.) | (4 475) | 5 841 | 12 893 | 12 214 | 17 020 | 20 739 | 23 635 | 26 002 |
| Income Taxes Paid | (43) | 136 | 588 | 663 | 2 205 | 4 078 | 4 624 | 5 062 |
| Net Income (adj.) | (4 432) | 5 705 | 12 305 | 11 551 | 14 815 | 16 661 | 19 011 | 20 940 |
| Dilluted EPS | $(0,47) | $0,60 | $1,28 | $1,65 | $1,51 | $1,73 | $1,96 | $2,15 |