Investment Review №340. The Bombshell Effect

Vadim Merkulov
Head of Analytics department
Burke & Herbert: A Banking Classic
BHRB shares offer attractive investment potential, with a 12-month target price of $74
About company
Burke & Herbert Financial Services Corp (BHRB). is a regional bank operating in the U.S. Mid-Atlantic region, including Virginia, Maryland, West Virginia, Delaware, and Kentucky. Following the integration of Summit Financial Group, the bank has entered a phase of earnings normalization, improved funding structure, and further business scaling. Strong results for the fourth quarter of 2025, a solid capital position and substantial liquidity buffer, as well as the upcoming merger with LINKBANCORP, create an attractive investment profile over the next 12 months.
| Ticker | BHRB |
| Share price as of analysis | $62,98 |
| Target share price | $74 |
| Growth potential | 17,5% |
| Share price dynamics vs. indices | Day | Week | Month | Quarter | Year |
| BHRB | (0,2%) | (4,2%) | (9,5%) | (8,6%) | 8,2% |
| S&P 500 | (0,2%) | (0,5%) | (2,3%) | (1,5%) | 20,8% |
| Russell 2000 | (0,2%) | (2,3%) | (4,9%) | (0,5%) | 26,2% |
| DJ Industrial Average | (0,1%) | (1,6%) | (4,9%) | (0,7%) | 13,8% |
| NASDAQ Composite Index | 0,0% | 0,8% | (1,8%) | (4,0%) | 29,9% |
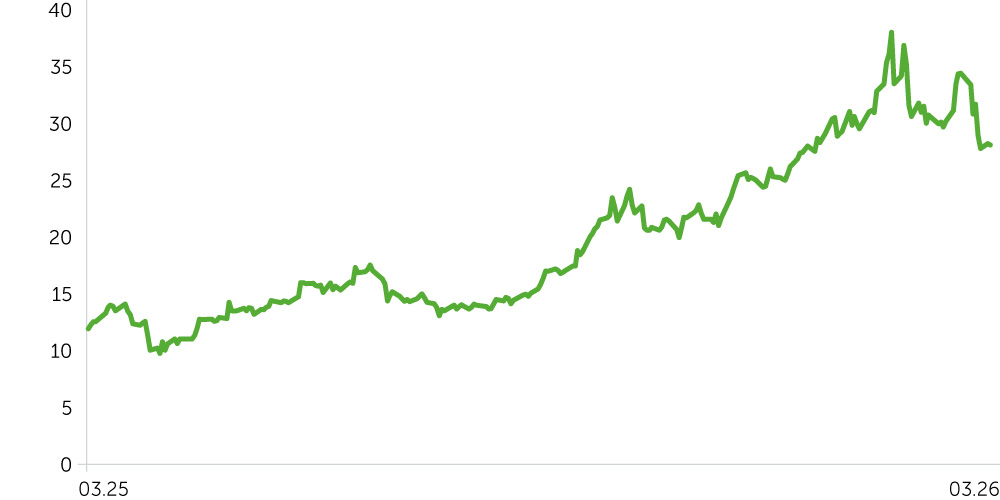
Price dynamics ERO, $
Key Investment Theses
Strong financial performance and expansion of the net interest margin. In the fourth quarter of 2025, Burke & Herbert reported $30.0 million in net income, while diluted earnings per share reached $1.98, up from $1.30 a year earlier. Quarterly revenue totaled $86.6 million, with the net interest margin expanding to 4.11%. A key driver was the decline in funding costs: the average cost of total deposits fell to 1.80%, reflecting the gradual replacement of higher-cost funding sources and continued optimization of the deposit base. Against this backdrop, net interest income reached $74.9 million, highlighting the resilience of the bank’s core banking model. For the full year, earnings per share amounted to $7.72, while return on average equity exceeded 14%, confirming the bank’s ability to maintain a strong profitability profile following the completion of the main phase of the Summit integration.
A strong capital position and substantial liquidity support the bank’s financial resilience. As of the end of 2025, BHRB maintained a comfortable capital buffer, with a CET1 ratio of 13.2% and a total capital ratio of 15.9%. Available liquidity, including cash and unused funding lines, totaled approximately $4.8 billion, more than twice the level of uninsured deposits. This balance sheet structure provides the bank with a high degree of financial flexibility and allows it to continue supporting dividend payments while retaining sufficient resources to fund future growth.
The merger with LINKBANCORP represents the next stage of scaling. The merger agreement signed in December 2025 envisages the creation of a banking group with approximately $11 billion in assets and a network of more than 100 branches across six Mid-Atlantic states. For Burke & Herbert, the transaction will expand its geographic footprint, strengthen its competitive positioning, and increase operational scale. Following the completion of the transaction, the combined entity is expected to benefit from a more diversified deposit base and additional earnings growth potential driven by operating synergies and improved efficiency. Against the backdrop of already achieved post-Summit normalization, the merger may serve as an additional catalyst for a re-rating of the shares in the medium term.
We estimate the upside potential of BHRB shares at approximately 17.5% over the next 12 months. Our target price is $74, and our recommendation is Buy. As a risk-management level, we suggest considering a stop-loss at $56.
| Ratio Analysis | 2023A | 2024A | 2025A | 2026E | 2027E | 2028E | 2029E | 2030E |
| ROE | 7,21% | 4,89% | 13,73% | 11,22% | 13,51% | 12,84% | 12,66% | 12,42% |
| Cost of Risk | 0,01% | 0,43% | 0,03% | 0,56% | 0,13% | 0,15% | 0,15% | 0,15% |
| Efficiency Ratio | 77,37% | 75,52% | 57,18% | 51,66% | 51,99% | 52,96% | 52,84% | 52,30% |
| P/E (x) | 23,67x | 14,43x | 8,13x | 8,60x | 6,37x | 6,02x | 5,48x | 5,01x |
| P/B (x) | 1,28x | 1,28x | 1,25x | 1,62x | 1,54x | 1,48x | 1,44x | 1,02x |
| Margins, % | 2023A | 2024A | 2025A | 2026E | 2027E | 2028E | 2029E | 2030E |
| Net Interest Margin | 3% | 3% | 4% | 4% | 4% | 4% | 4% | 4% |
| Financials, $mln | 2023A | 2024A | 2025A | 2026E | 2027E | 2028E | 2029E | 2030E |
| Interest Income | 147 | 366 | 445 | 573 | 677 | 731 | 792 | 847 |
| Interest Expense | -53 | -140 | -149 | -179 | -206 | -221 | -237 | -255 |
| Net Interest Income | 94 | 226 | 296 | 395 | 471 | 510 | 555 | 592 |
| Loan Loss Provision | 0 | -24 | -2 | -40 | -11 | -14 | -16 | -17 |
| Non-Interest Income | 18 | 36 | 46 | 58 | 66 | 75 | 86 | 99 |
| Non-Interest Expense | -86 | -198 | -196 | -234 | -279 | -310 | -339 | -361 |
| Pretax Income | 25 | 40 | 145 | 179 | 247 | 261 | 287 | 313 |
| Tax Expense | -2 | -4 | -28 | -31 | -47 | -50 | -55 | -60 |
| Net Income | 23 | 36 | 117 | 148 | 200 | 211 | 232 | 253 |
| Basic EPS | $3 | $4 | $4 | $7 | $10 | $10 | $12 | $13 |
| Dividends Per Share | $1 | $1 | $2 | $2 | $2 | $2 | $3 | $3 |