Investment Review №341. The Obvious and the Unbelievable

Vadim Merkulov
Head of Analytics department
Everus Construction Group. Power for AI
ECG shares are worth buying, with a target price of $138
About company
Everus Construction Group (ECG) is a U.S.-based contractor specializing in electrical and network infrastructure projects. The company operates at the intersection of two key segments, data center construction and power system modernization, where demand is supported by the growth of AI and rising electricity consumption. The project portfolio is shifting toward more complex and mission-critical assets, which enhances margins and business resilience, while long-term contracts with utility companies provide stable utilization and revenue visibility.
| Ticker | ECG |
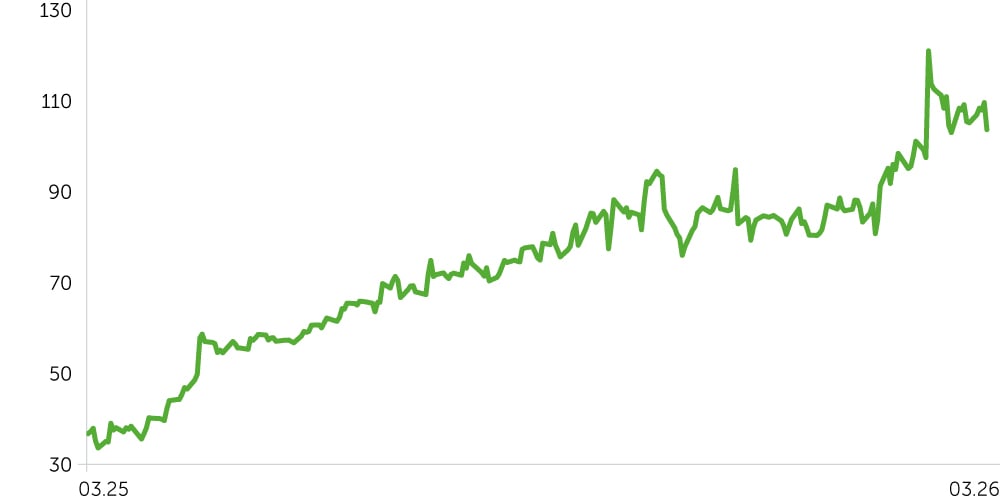
| Share price as of analysis | $117,27 |
| Target share price | $138,00 |
| Growth potential | 18% |
| Share price dynamics vs. indices | Day | Week | Month | Quarter | Year |
| ECG | 5,7% | 2,4% | 10,5% | 30,4% | 199,1% |
| S&P 500 | 1,1% | (1,8%) | (3,8%) | (4,8%) | 16,1% |
| Russell 2000 | 2,3% | (0,4%) | (4,8%) | (1,8%) | 21,3% |
| DJ Industrial Average | 1,4% | (1,6%) | (5,3%) | (4,6%) | 10,1% |
| NASDAQ Composite Index | 1,4% | (1,9%) | (3,0%) | (6,9%) | 23,4% |
Price dynamics ECG, $
Key Investment Theses
ECG is delivering sustained financial growth. The company demonstrates solid momentum, with revenue increasing 33% y/y in 4Q25 to $1.0 billion and reaching $3.75 billion for full-year 2025 (+31.5% y/y). Growth is accompanied by improving operating performance and reflects strong project execution within the E&M segment, which remains the primary business driver. Management expects further growth to $4.1–4.2 billion in 2026, confirming continued strong demand and high capacity utilization.
Data centers are a key driver of both growth and profitability. Hyperscale and AI infrastructure projects require more complex engineering, higher reliability, and accelerated execution timelines, which increases contract value and reduces pricing pressure. This is already evident in the results: the E&M segment, which includes data center-related work, grew 44% y/y in 4Q25 to $792 million, while EBITDA increased 57% with margin expansion to 8.5%. As a result, a higher share of data center revenue is driving not only top-line acceleration but also improved earnings quality.
Backlog provides strong revenue visibility and supports earnings stability. Total backlog reached approximately $3.2 billion (+16% y/y), covering a significant portion of near-term revenue. The T&D segment increased 40%, reflecting accelerated utility investment in grid modernization, while E&M grew 13%, confirming sustained activity in data center construction. This diversified order mix supports stable capacity utilization and underpins continued financial growth over a 12–24 month horizon.
We set a target price for ECG at $138 with a “Buy” recommendation. A stop-loss is advised at the $104 level.
| Ratio Analysis | 2024A | 2025A | 2026E | 2027E | 2028E | 2029E | 2030E |
| ROE | 32,9% | 38,3% | 28,3% | 26,0% | 23,2% | 21,4% | 19,9% |
| ROA | 12,3% | 13,4% | 11,3% | 12,0% | 11,6% | 11,9% | 12,1% |
| ROCE | 20,0% | 22,8% | 19,3% | 19,6% | 20,2% | 20,6% | 19,3% |
| Sales/Assets (x) | 2,43x | 2,48x | 2,26x | 2,22x | 2,12x | 2,13x | 2,12x |
| Interest Coverage (x) | 2,3x | 13,3x | 18,5x | 24,2x | 27,3x | 57,9x | N/A |
| Margins, % | 2024A | 2025A | 2026E | 2027E | 2028E | 2029E | 2030E |
| Gross Margin | 12% | 12% | 12% | 12% | 12% | 12% | 12% |
| EBITDA Margin | 8% | 9% | 8% | 8% | 9% | 9% | 9% |
| Net Margin | 5% | 5% | 5% | 5% | 5% | 6% | 6% |
| Financials, $mln | 2024A | 2025A | 2026E | 2027E | 2028E | 2029E | 2030E |
| Выручка | 2 850 | 3 746 | 4 160 | 4 685 | 5 070 | 5 374 | 5 696 |
| Основные расходы | -2 510 | -3 292 | -3 677 | -4 136 | -4 470 | -4 739 | -5 023 |
| Валовая прибыль | 339 | 454 | 483 | 549 | 599 | 635 | 673 |
| SG&A | -150 | -189 | -212 | -225 | -244 | -258 | -274 |
| EBITDA | 230 | 323 | 330 | 396 | 439 | 471 | 504 |
| Амортизация | -25 | -29 | -36 | -45 | -53 | -61 | -69 |
| EBIT | 190 | 265 | 271 | 324 | 355 | 377 | 399 |
| Процентные выплаты (доходы) | -14 | -20 | -15 | -13 | -13 | -7 | 0 |
| EBT | 193 | 274 | 279 | 338 | 373 | 403 | 435 |
| Налоги | 50 | 72 | 71 | 86 | 95 | 102 | 110 |
| Чистая прибыль | 143 | 202 | 209 | 252 | 278 | 301 | 325 |
| Basic EPS | $2,81 | $3,94 | $4,07 | $4,93 | $5,65 | $6,36 | $7,15 |
| DPS | $0,00 | $0,00 | $0,00 | $0,00 | $0,32 | $0,36 | $0,41 |