Investment Review №344. A Commitment to Techno-Optimism

Vadim Merkulov
Head of Analytics department
Nextpower. A Place Under the Sun
NXT shares look attractive for purchase with an investment horizon of around one year and a target price of $142.
About company
Nextpower (NXT) is a leading provider of intelligent solar tracker and power systems for utility-scale solar projects. The company has entered the next stage of growth after rebranding from Nextracker to Nextpower, reflecting its transition from a pure-play tracker supplier into a broader solar technology platform. Strong Q3 FY2026 results, a raised full-year outlook, record backlog, and expansion into higher-value solutions support a favorable investment case over the next 12 months.
| Ticker |
NXT |
| Close price at the analysis time | $123,34 |
| Target Price | $142 |
| Upside | 15,1% |
| Stock vs Indexes | Day | Week | Month | Quarter | Year |
| NXT | (2,5%) | (4,6%) | 3,4% | 0,2% | 177,1% |
| S&P 500 | (0,4%) | 0,4% | 9,4% | 4,6% | 26,6% |
| Russell 2000 | (0,6%) | 0,3% | 10,5% | 6,5% | 38,4% |
| DJ Industrial Average | (1,1%) | (0,5%) | 5,2% | (1,1%) | 18,5% |
| NASDAQ Composite Index | (0,2%) | 0,7% | 14,6% | 9,4% | 39,4% |
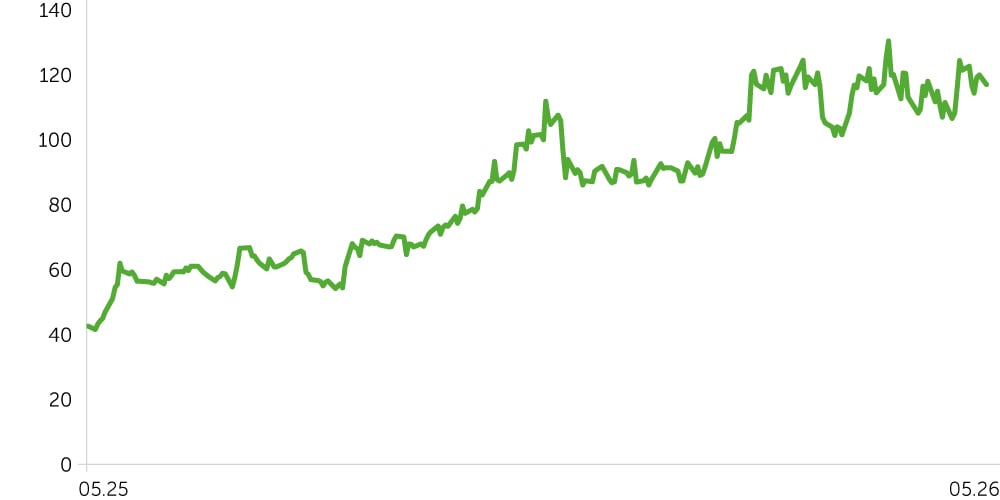
Price dynamics NXT, $
Key Investment Theses
Strong financial momentum and raised outlook. In Q3 FY2026, Nextpower delivered revenue of $909 mn, up 34% YoY, while GAAP operating income increased 17% YoY to $176 mn. Despite some margin pressure from project mix and higher costs, profitability remained solid, with adjusted EBITDA of $214 mn. Management also raised FY2026 guidance to $3.425–3.500 bn in revenue and adjusted EPS of $4.26–4.36, confirming that demand and execution remain ahead of prior expectations.
Record backlog provides strong revenue visibility. Nextpower continues to benefit from strong order intake in the U.S., Europe, and international markets. The company reported record backlog and secured major project wins, including a 2.25 GW supply commitment through Nextpower Arabia for the Bisha Solar Project. This provides strong visibility for future revenue conversion and supports the company’s medium-term growth trajectory.
Expansion into an integrated power technology platform. The company is broadening its offering beyond solar trackers into a more complete utility-scale solar solution, including eBOS, NX Earth Truss, NX Horizon Hail Pro, TrueCapture software, power conversion solutions, and monitoring/cleaning technologies through the Fracsun acquisition. These initiatives should increase customer value, support bundled project wins, and improve the long-term margin profile as the business mix shifts toward higher-value solutions.
Strong balance sheet and shareholder support. Nextpower ended Q3 FY2026 with approximately $953 mn in cash and no debt, while generating $391 mn of operating cash flow year-to-date. The company also achieved an investment-grade credit rating and authorized a $500 mn share repurchase program, strengthening investor confidence and giving management flexibility to fund growth, pursue selective acquisitions, and return capital to shareholders.
We estimate a 12-month upside potential of approximately 15.1% for NXT shares. Our target price is $142 with a Buy recommendation, supported by strong backlog conversion, raised guidance, continued product expansion, and a debt-free balance sheet. As a risk-management level, we suggest considering a stop-loss at around $111.
| Ratios | 2024A | 2025A | 2026E | 2027E | 2028E | 2029E | 2030E | 2031E |
| ROE | 41% | 39% | 29% | 28% | 29% | 30% | 30% | 28% |
| ROA | 16% | 18% | 15% | 15% | 17% | 18% | 19% | 19% |
| ROCE | 36% | 30% | 24% | 25% | 27% | 28% | 29% | 28% |
| Sales/Assets (x) | 1,0x | 0,9x | 0,9x | 0,9x | 0,8x | 0,8x | 0,8x | 0,7x |
| Interest Coverage (x) | 42,5x | 48,8x | 171,2x | 492,1x | 851,3x | 1493,3x | 3017,2x | 4420,0x |
| Margins | 2024A | 2025A | 2026E | 2027E | 2028E | 2029E | 2030E | 2031E |
| Gross Margin | 33% | 34% | 32% | 31% | 33% | 34% | 36% | 37% |
| EBITDA Margin | 21% | 26% | 24% | 23% | 23% | 24% | 24% | 24% |
| Net Margin | 4% | (2%) | 7% | 7% | 8% | 7% | 5% | 4% |
| Financials, $M | 2024A | 2025A | 2026E | 2027E | 2028E | 2029E | 2030E | 2031E |
| Revenue | 2 500 | 2 959 | 3 464 | 4 039 | 4 598 | 5 142 | 5 751 | 6 000 |
| COGS | 1 687 | 1 950 | 2 365 | 2 769 | 3 084 | 3 372 | 3 685 | 3 754 |
| Gross Income | 813 | 1 009 | 1 099 | 1 269 | 1 514 | 1 770 | 2 066 | 2 246 |
| G&A | 184 | 290 | 331 | 342 | 355 | 358 | 357 | 328 |
| EBITDA (adj.) | 522 | 777 | 832 | 922 | 1 050 | 1 226 | 1 378 | 1 450 |
| D&A | 4 | 13 | 24 | 28 | 32 | 36 | 39 | 39 |
| Interest expense (income) | 9 | (9) | (22) | (31) | (32) | (38) | (48) | (63) |
| Pretax Income | 608 | 648 | 688 | 847 | 1 071 | 1 320 | 1 616 | 1 840 |
| Income Taxes Paid | (112) | (131) | (145) | (178) | (225) | (277) | (339) | (386) |
| Net Income | 94 | (68) | 249 | 295 | 364 | 380 | 273 | 221 |
| Dilluted EPS | $3,37 | 3,47 | $3,51 | $4,37 | $5,57 | $6,96 | $8,66 | $9,96 |