Investment Review №329. It's time to take a risk

Vadim Merkulov
Head of Analytics department
WabTec. By railcars
WAB shares are attractive for purchase with a target price of $226
About Company
Westinghouse Air Brake Technologies Corp. (WAB), or WabTec, specializes in delivering equipment, systems, and providing services tailored for the railroad industry. The company operates through two segments. The Freight segment builds new locomotives, refurbishes existing ones, produces and services components for both new and existing freight cars and locomotives. Additionally, it supplies railroad electronics and other components. The Transit segment manufactures and services components for both new and existing passenger vehicles, such as locomotives, subway trains, railcars, and buses.
| Ticker | WAB |
| Share price as of analysis | $197,96 |
| Target share price | $226 |
| Growth potential | 14,2% |
| Stock vs Indices | Day | Week | Month | Quarter | Year |
| WAB | 4,9% | 5,1% | 1,1% | (1,0%) | 10,5% |
| S&P 500 | 0,4% | 1,2% | 3,5% | 12,2% | 17,4% |
| Russell 2000 | 0,6% | 2,4% | 4,3% | 16,8% | 10,6% |
| DJ Industrial Average | 0,1% | 1,1% | 1,6% | 9,9% | 10,3% |
| NASDAQ Composite Index | 0,7% | 2,0% | 6,0% | 17,2% | 27,0% |
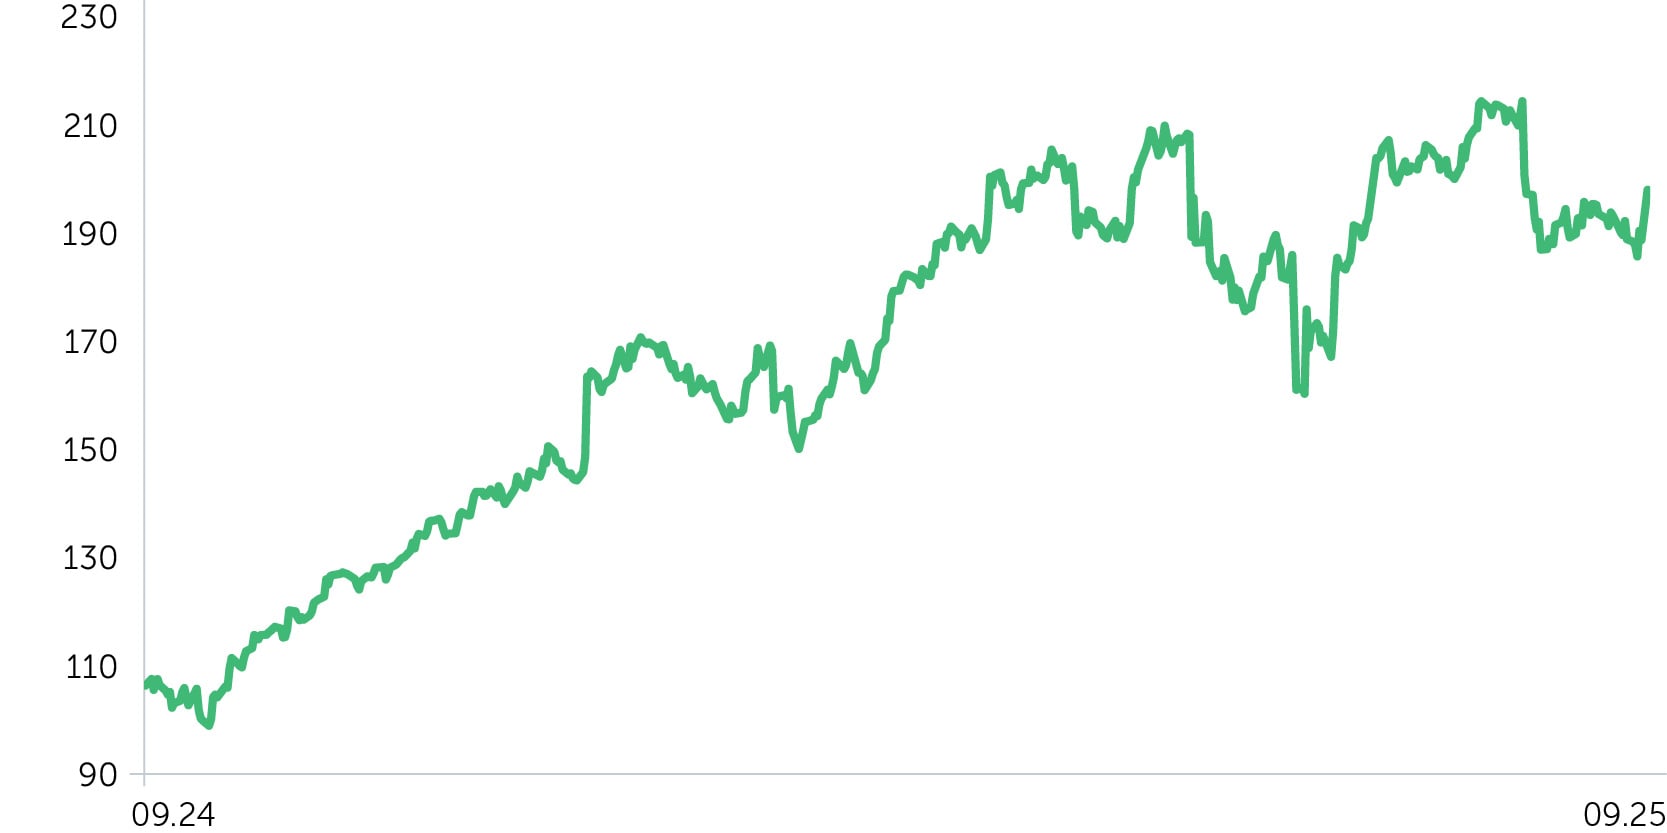
Price dynamics WAB, $
Investment Thesis
- The company’s fundamentals are on an upward trajectory. In the first half of 2025, Wabtec demonstrated a notable expansion in profitability, with the adjusted operating margin increasing to 21.1%, and quarterly adjusted EPS rising approximately 15-16% y/y. Additionally, the 12-month order backlog exceeded $8.2 billion, providing strong visibility into revenue and earnings for the coming year.
- Concurrently with operational enhancements, the company is vigorously expanding its portfolio. In recent months, the company has finalized the acquisition of Inspection Technologies (effective July 1) and has signed agreements to acquire Frauscher Sensor Technology (expected to close before the year’s end) and Dellner Couplers (scheduled for completion in the first half of 2026, subject to regulatory approval). Management estimates that the total investment in these three deals amounts to approximately $3.5 billion, with expectations of generating about $850 million in annual revenue and around $217 million in EBITDA in the first year. These acquisitions are also projected to yield synergies of approximately $60 million. By the end of the year, management predicts an acceleration in organic growth and improvements in its margins.
- Additionally, the company’s growth will be driven by a recent development: on September 22, Wabtec inked a multi-year contract with Kazakhstan Temir Zholy for its Evolution series, marking the largest deal in the company’s history. This announcement notably boosted the stock, which climbed 4.9% on the same day. Deliveries under this contract are slated for the next 5-10 years. LKZ, the primary beneficiary of this contract and a Wabtec-managed entity, boasts a net margin of about 15%, surpassing the corporation-wide average. This implies that the discounted favorable effect of the contract may not yet be fully reflected in the share price.
The target price is $226. The recommendation is “Buy”, with a stop loss advisable at $179.
| Marginality % | 2022A | 2023A | 2024A | 2025E | 2026E | 2027E | 2028E | 2029E |
| Gross margin | 31% | 31% | 33% | 34% | 34% | 34% | 34% | 34% |
| EBITDA Non-GAAP (non-adj) margin | 16% | 17% | 19% | 20% | 21% | 21% | 22% | 22% |
| Net Income margin | 11% | 11% | 13% | 14% | 14% | 15% | 16% | 15% |
| Ratio Analysis | 2022A | 2023A | 2024A | 2025E | 2026E | 2027E | 2028E | 2029E |
| ROE | 9% | 10% | 13% | 14% | 15% | 16% | 16% | 16% |
| ROA | 5% | 6% | 7% | 7% | 8% | 9% | 9% | 9% |
| ROCE | 6% | 6% | 5% | 6% | 7% | 7% | 7% | 7% |
| Sales/Assets | 0,8x | 0,9x | 1,0x | 1,0x | 1,1x | 1,1x | 1,0x | 1,0x |
| Interest Coverage | 7,3x | 7,5x | 9,8x | 9,8x | 9,2x | 11,8x | 10,8x | 10,8x |
| Financial performance, $ mn | 2022A | 2023A | 2024A | 2025E | 2026E | 2027E | 2028E | 2029E |
| Revenue | 8 362 | 9 677 | 10 387 | 11 072 | 11 889 | 12 493 | 12 364 | 12 915 |
| COGS | 5 779 | 6 695 | 6 984 | 7 345 | 7 882 | 8 236 | 8 151 | 8 514 |
| Gross Income (adj.) | 2 583 | 2 982 | 3 403 | 3 727 | 4 007 | 4 257 | 4 213 | 4 401 |
| SG&A | 1 229 | 1 339 | 1 436 | 1 463 | 1 537 | 1 645 | 1 483 | 1 549 |
| Operating income (adj.) | 1 354 | 1 643 | 1 967 | 2 264 | 2 470 | 2 612 | 2 730 | 2 852 |
| A&D | 479 | 529 | 501 | 470 | 492 | 487 | 497 | 519 |
| Interest expense (income) | 186 | 218 | 201 | 231 | 268 | 221 | 252 | 263 |
| Pretax Income (adj.) | 1 197 | 1 434 | 1 764 | 1 962 | 2 174 | 2 346 | 2 478 | 2 589 |
| Income Taxes | 307 | 368 | 440 | 425 | 477 | 479 | 540 | 611 |
| Net Income (adj.) | 890 | 1 066 | 1 324 | 1 537 | 1 698 | 1 867 | 1 939 | 1 978 |
| Dilluted EPS | $4,86 | $5,92 | $7,56 | $8,98 | $10,07 | $11,20 | $12,62 | $13,96 |
| DPS | $0,60 | $0,68 | $0,80 | $1,00 | $1,13 | $1,23 | $1,39 | $1,60 |