Investment Review №337. A shift toward hedging
Corporate News In Focus of Our Analysts
Delta Air Lines, United Airlines, American Airlines
The U.S. airline industry closed 2025 on a strong note, though performance among the Big Three was mixed. Delta Air Lines set an upbeat tone on January 13, with record full-year revenue of $58.3 billion. While Q4 revenue of $14.61 billion was a slight miss, EPS of $1.55 topped expectations.
United Airlines extended the momentum on January 20, posting the highest quarterly revenue in its history at $15.4 billion. UAL’s full-year EPS rose 8% to $10.20, prompting management to guide to even stronger results in 2026.
Rounding out the group, American Airlines reported on January 27. Despite a record $14.0 billion in quarterly revenue, adjusted EPS of $0.16 came in well below market expectations. Even so, a greater emphasis on premium services and a $2.1 billion year-over-year reduction in debt support a cautiously optimistic outlook for 2026.
AAL - $16 (under review), Buy.
DAL - $89, Buy.
UAL - $143, Buy.
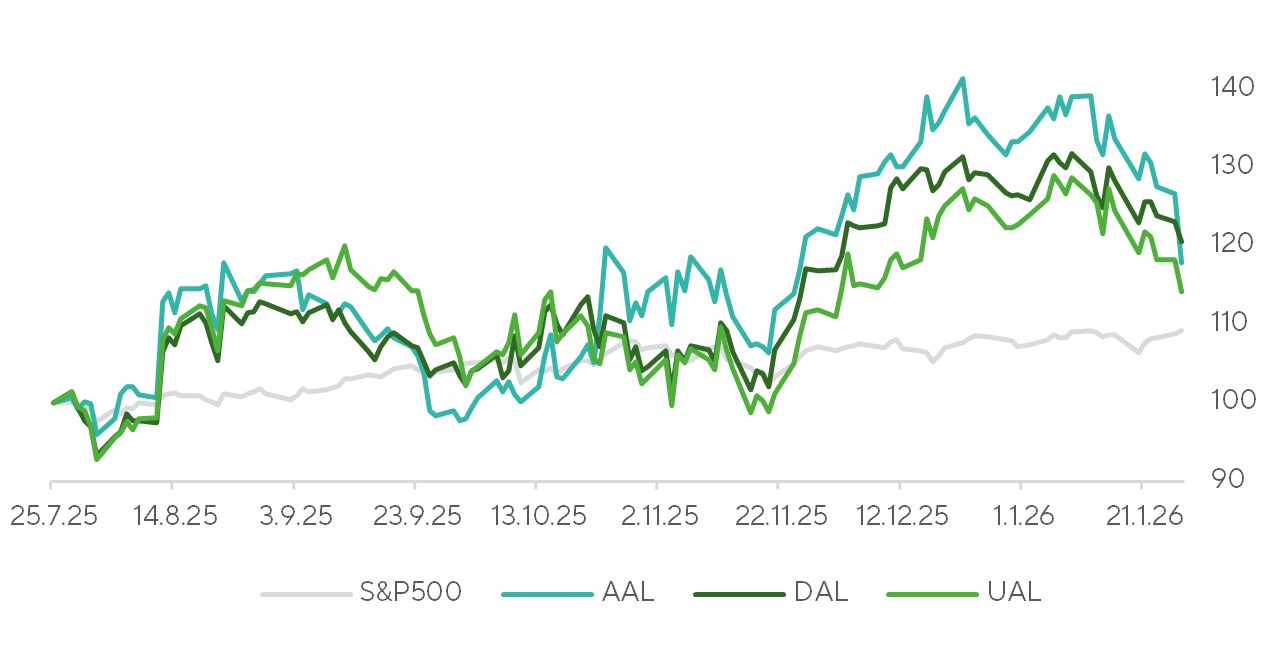
Airline Share Price Performance
Sources: FactSet, Freedom Broker Analysis
Netflix
On January 21, Netflix (NFLX) reported Q4 2025 results. Revenue reached $12.05 billion (+17.6% YoY, +4.7% QoQ), slightly ahead of both market consensus and management’s guidance of roughly $11.96 billion, driven by strong subscriber growth, pricing, and rising advertising revenue. The company achieved a milestone of 325 million paid subscribers. Operating income totaled $2.96 billion (+30.1% YoY, -9.0% QoQ), just above FactSet’s consensus of $2.92 billion and ahead of management’s forecast of $2.86 billion. Operating margin expanded by 230 basis points YoY to 24.5% but contracted by 370 basis points QoQ due to typical seasonality. Despite this, management guidance for Q1 and FY26 skewed conservative versus Street expectations. Management forecasts 1Q FY26 revenue to amount to $12.16 billion (+15.3% YoY, +0.9% QoQ), just below the $12.19 billion market consensus, and projects full-year 2026 revenue to reach $50.7-51.7 billion (+12-14% YoY), modestly above FactSet’s consensus of $51.0 billion. Q1 FY26 operating income is guided at $3.91 billion (+16.7% YoY, +32.1% QoQ), below FactSet’s consensus of $4.16 billion. For FY 2026, management projects the operating margin to expand by 200 basis points YoY to 31.5%, including approximately $275 million in expenses related to the Warner Bros. acquisition. Excluding these M&A-related expenses, the margin expansion would have been 250 basis points to 32.0%.
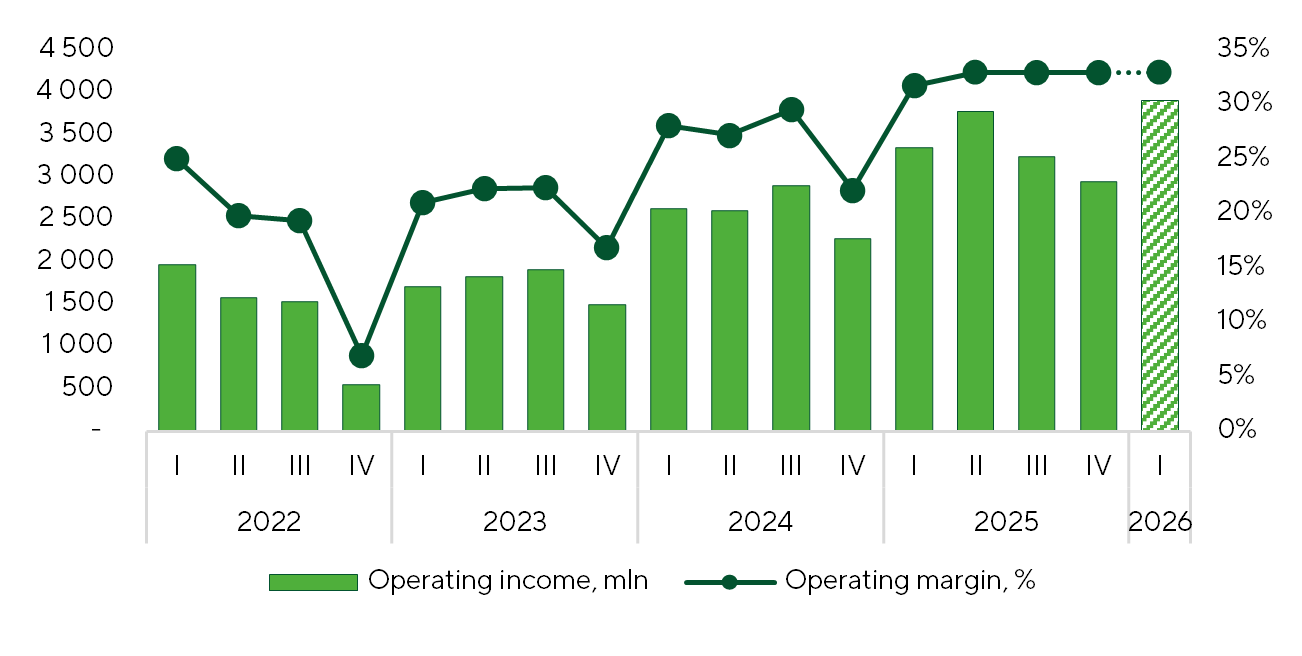
Netflix's Operating Income and Margin
Sources: FactSet, Netflix
TSMC, Intel Results
In recent weeks, both TSMC (TSM) and Intel (INTC) reported quarterly results. TSMC’s Q4 FY25 once again exceeded market expectations on all metrics, delivering record gross margins and strong profitability growth on the back of robust demand for advanced process technologies. Management’s guidance for Q1 and FY 2026 came in well above consensus forecasts. Confident in multi-year AI demand, TSMC plans 2026-2028 capital expenditures that will significantly exceed the $101 billion invested over the prior three years, while targeting a gross margin of 56%+ and ROE of 25-30%, due to disciplined capacity planning and manufacturing excellence. TSMC’s management reiterated the conviction in the multi-year AI megatrend and raised long-term industry growth forecasts, underscoring confidence in the durability of demand. Intel also ended the year with strong results, beating expectations on revenue, profitability, and EPS. Recent PC shipment strength has been driven by Intel’s effort to recapture market share from AMD and by inventory builds amid surging memory costs, with PC shipments expected to decline 2-3% YoY in 2026. Despite the solid quarter, Intel’s guidance was disappointing, reflecting capacity constraints and higher memory costs. The company is still seeking strategic customers for its foundry business, and while 2026 capex guidance is a bit up, uncertainty remains heightened.
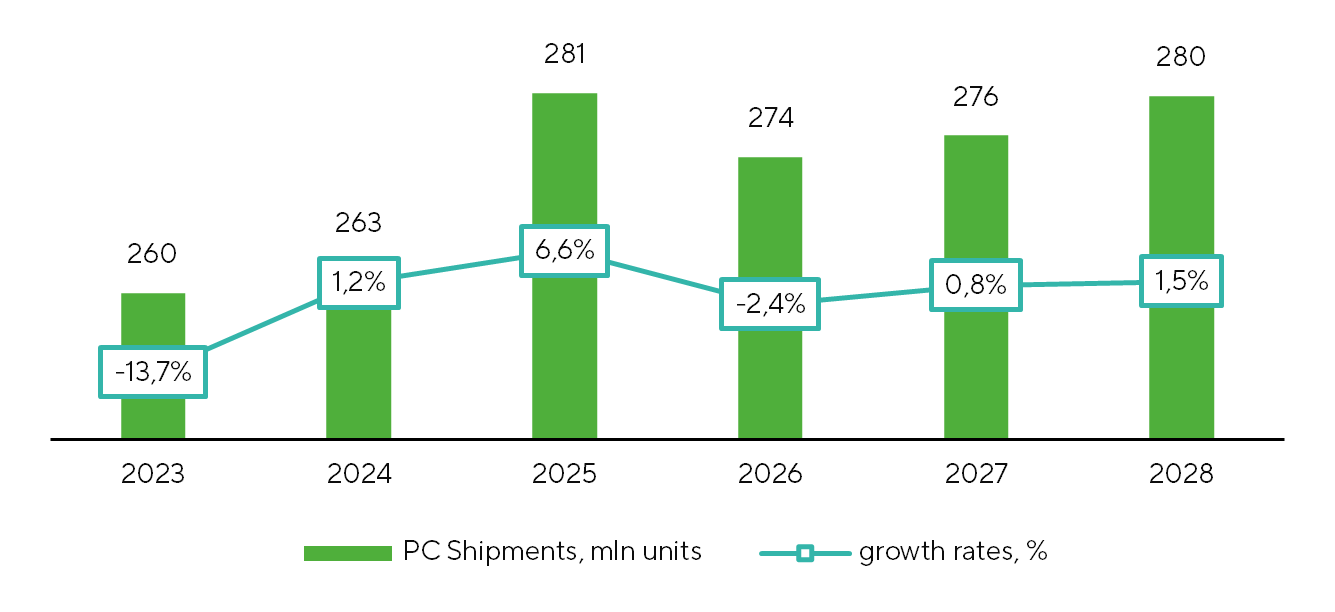
Global PC shipments
Sources: IDC, Freedom Broker
Capital One, Synchrony Financial, Bread Financial
Donald Trump’s January 10 statement on a one-year cap on credit card APRs at 10% starting January 20 created short-term pressure across consumer finance. As the discussion progressed, however, focus shifted from the prospect of immediate executive action to the reality that any cap would require congressional approval, reducing the risk.
At Davos on January 25, Trump again criticized elevated interest rates and urged Congress to back the initiative. JPMorgan (JPM) CEO Jamie Dimon called the proposal an “economic disaster,” warning it would curtail credit availability and suggesting it be considered only as a limited state-level pilot. Banking associations argued that a hard cap could prompt issuers to discontinue as many as 85% of existing credit cards. Bank of America (BAC) and Citigroup (C) have discussed issuing cards capped at a fixed 10% rate, though Citi CEO Jane Fraser underscored the lack of congressional support for the measure.
The market initially sold off: on January 12, financials broadly declined (JPM, BAC, C, WFC, V, MA, AXP), with card-centric lenders—Capital One (COF), Synchrony Financial (SYF), and Bread Financial (BFH) — falling 8-11%. The BNPL consumer finance cohort (e.g., Affirm, Dave) also came under pressure, even though their models are less dependent on interest income. Notably, the latter two groups—card-centric lenders and BNPL providers—have yet to rebound, suggesting investors do not view the rate-cap risk as merely hypothetical.
The initially flagged January 20 start date has passed without action, and related legislative efforts remain stalled. Assuming a low probability of enactment, particularly given that the original proposal contemplated only a one-year cap, the market reaction appears to reflect an overestimation of regulatory risk rather than a deterioration in sector fundamentals. For context, average credit card APRs are widely estimated at roughly 20–24%.
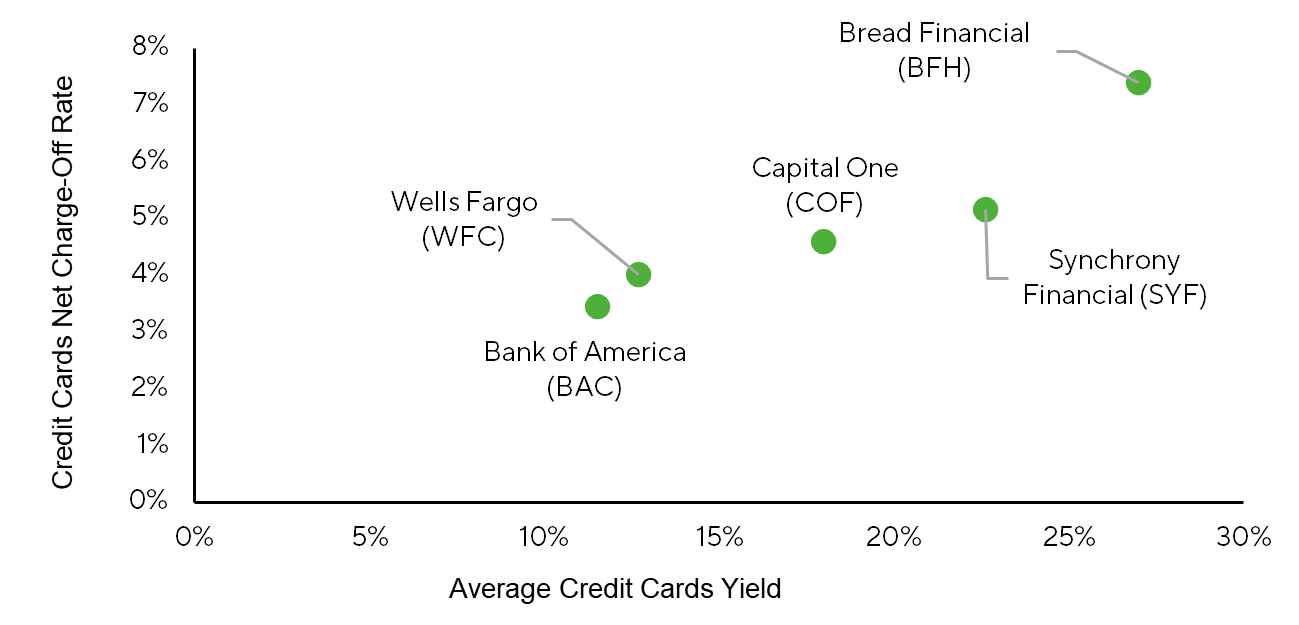
Selected Metrics for Major Card Issuers
Source: Companies' filings, Freedom Broker's analysis
J.P. Morgan, Citi, Wells Fargo, Goldman Sachs, Bank of America
The largest U.S. banks delivered mostly solid Q4 2025 results. Where EPS missed, it was largely due to one-off items—provisions tied to the acquired Apple Card portfolio at JPMorgan (JPM), the sale of the Russian business at Citi (C), and severance costs at Wells Fargo. Despite mixed revenue trends and the lack of broad-based “beat-and-raise” scenario, banks showed stable asset quality, sustained loan growth led by the corporate segment, and overall operational stability.
For universal banks, net interest income was the primary driver of upside, while noninterest revenue was mixed versus expectations. Management teams are anchoring guidance around two to three rate cuts in 2026, with the impact on NII expected to be partially offset by loan book growth. Investment banking results were unequivocally positive amid a capital markets recovery; executives cited a healthy deal pipeline and sounded constructive into early 2026.
On expenses, approaches remain differentiated: JPMorgan and Goldman Sachs (GS) are prepared for faster expense growth, driven by investment in technology and competitive positioning, while Bank of America (BAC), Wells Fargo (WFC), and Citigroup continue to emphasize efficiency gains. Overall capital positions remain strong, supporting shareholder returns, though buyback pace in some cases (e.g., WFC) may be more muted than last year.
| Ticker | Efficiency | ∆ | EPS | ∆ | Book per share | ∆ | RoTE | ∆ | P/E | P / Tangible Book | Target Price | Current Price | Potential | ||||||
| LTM | NTM | p.p. | LTM | NTM | % | LTM | NTM | % | LTM | NTM | p.p. | LTM | NTM | LTM | NTM | ||||
| JPM | 52,4% | 54,2% | 1,8 | 20,0 | 21,3 | 6,3% | 125,0 | 134,4 | 7,6% | 20,0% | 19,5% | -0,5 | 15,0 | 14,1 | 2,83 | 2,63 | 320 | 301,0 | 6% |
| BAC | 63,2% | 60,6% | -2,7 | 3,8 | 4,3 | 12,8% | 38,0 | 40,7 | 7,2% | 14,1% | 15,2% | 1,0 | 13,6 | 12,0 | 1,80 | 1,70 | 61 | 52,0 | 17% |
| C | 64,7% | 59,8% | -4,9 | 7,0 | 10,3 | 47,7% | 108,4 | 119,3 | 10,0% | 7,6% | 10,6% | 3,1 | 16,5 | 11,2 | 1,19 | 1,09 | 135 | 114,8 | 14% |
| WFC | 65,5% | 63,0% | -2,5 | 6,3 | 7,0 | 12,3% | 52,3 | 56,7 | 8,6% | 14,6% | 15,4% | 0,8 | 14,1 | 12,5 | 1,95 | 1,83 | 100 | 88,1 | 14% |
| GS | 64,4% | 61,3% | -3,2 | 51,3 | 58,6 | 14,3% | 364,0 | 376,3 | 3,4% | 15,8% | 17,4% | 1,5 | 18,2 | 15,9 | 2,73 | 2,64 | 940 | 931,9 | 1% |
| MS | 68,4% | 67,7% | -0,8 | 10,2 | 11,3 | 10,8% | 63,0 | 69,2 | 9,9% | 21,5% | 21,8% | 0,3 | 17,8 | 16,1 | 3,74 | 3,33 | 185 | 181,9 | 2% |
Major U.S. Banks Results
Sources: FactSet, Bank Data, Freedom Broker Analysis