Investment Review №340. The Bombshell Effect
Review as of March 11
Global Perspective
Over the past two weeks, the breadth of the equity rally has notably deteriorated as rising geopolitical tensions weigh on risk appetite. Investors are increasingly focused on the implications of what effectively amounts to an energy supply shock. Against this backdrop, most major equity benchmarks finished the two-week period in the red: the S&P 500 declined 0.6%, while the Dow Jones Industrial Average underperformed, falling 2.2%. Selling pressure was most pronounced in the small- and mid-cap space. The Russell 2000 fell 2.6%, while the S&P MidCap 400 declined 2.7%. The key outlier was the IT sector. A locally oversold setup supported a rebound in tech stocks, allowing the Nasdaq‑100 to gain 1.0% over the two-week stretch.
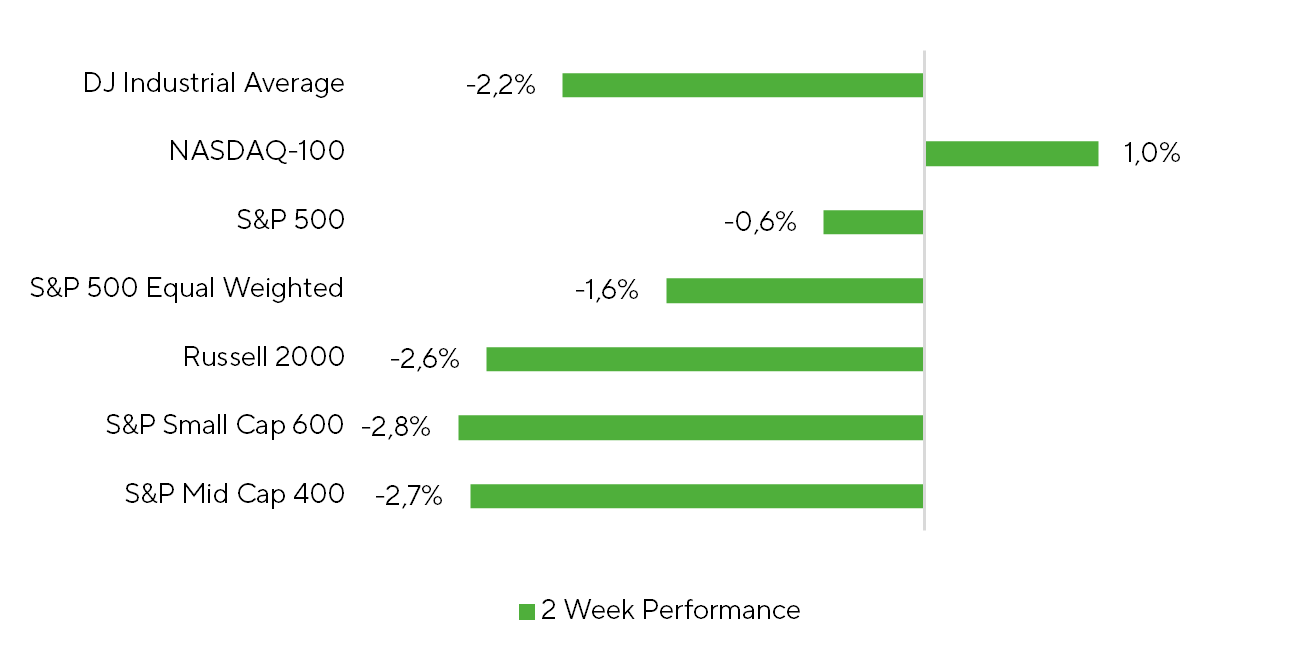
Benchmark Index Performance Over the Two-Week Period
Source: FactSet, Freedom Broker analysis
The relative resilience of the Nasdaq-100 largely reflects a rebound in software and cybersecurity after a sharp correction. The iShares Expanded Tech-Software Sector ETF (IGV) and First Trust NASDAQ Cybersecurity ETF (CIBR) — key proxies for the segments — gained 11.3% and 7.4% respectively by March 10 after bottoming in late February. We see both technical and fundamental drivers behind the rebound. Technically, valuations had entered oversold territory. The RSI for IGV fell below 30 in mid- to late February — a level last seen during the final phase of the 2022 bear market. The key fundamental catalyst was the long-awaited earnings report from Nvidia (NVDA) on February 25. The release helped calm market concerns by reaffirming the strong growth trajectory of one of the main beneficiaries of the AI cycle, pushing fears of AI displacement in the software sector into the background.
Nvidia reported strong results for FY2026 Q4, beating expectations across most metrics. The upside surprise was driven primarily by the Data Center segment, while Gaming and Automotive & Robotics came in somewhat weaker than expected. Gross margins remain elevated, though accelerating operating expenses are beginning to exert some pressure on operating margins. The balance sheet nevertheless suggests the company remains well positioned to support continued expansion and sustain high profitability, even amid persistent shortages of memory chips and other components. Guidance for the first quarter and management commentary regarding FY2027 point to accelerating revenue growth and sustained exceptionally high gross margins, well above consensus expectations. Further details on the product roadmap are expected at Nvidia GTC 2026, which begins on March 16.
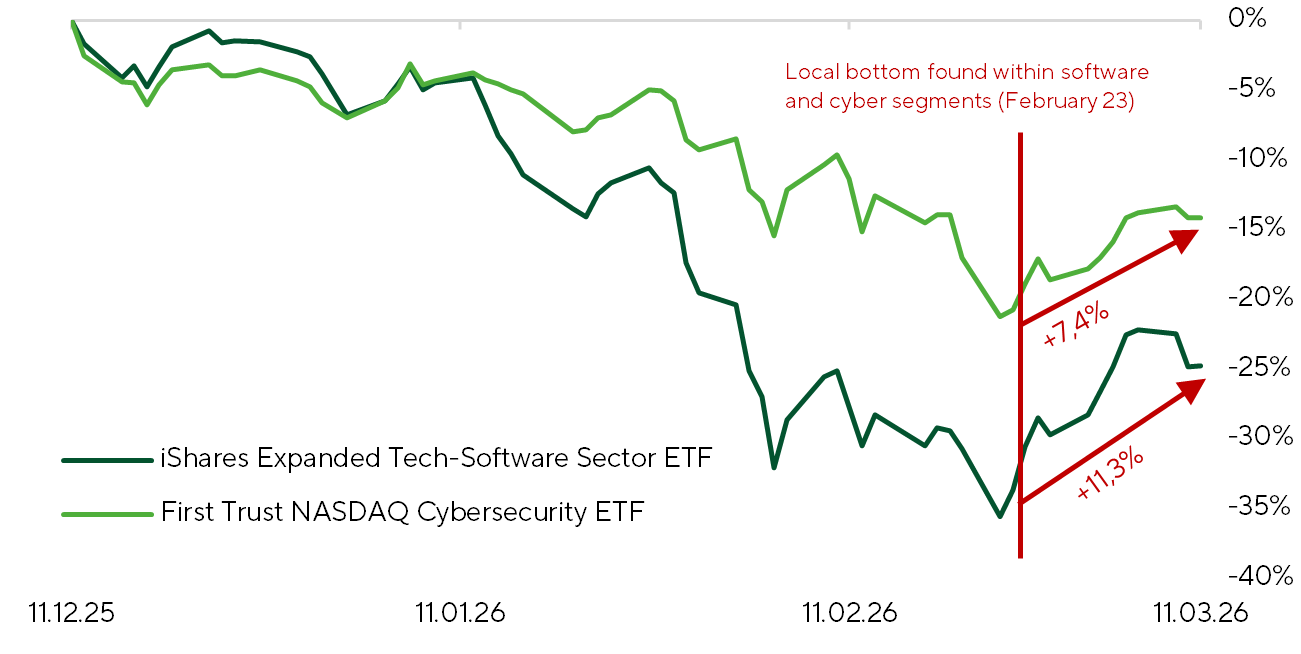
Normalized Performance of Software (IGV) and Cybersecurity (CIBR) Segments Over the Past Three Months
Source: FactSet, Freedom Broker analysis
The escalation of the Iran conflict has lifted volatility and stalled the market’s attempt at a broader rally. Market breadth has weakened sharply. The share of stocks posting gains has dropped below 50% across major indices. Within the S&P 500, Nasdaq-100, and Russell 2000, the proportion of gainers has fallen to 36.5%, 48.0%, and 40.6%, respectively. In other words, most stocks in the largest U.S. equity benchmarks have declined over the past two weeks.
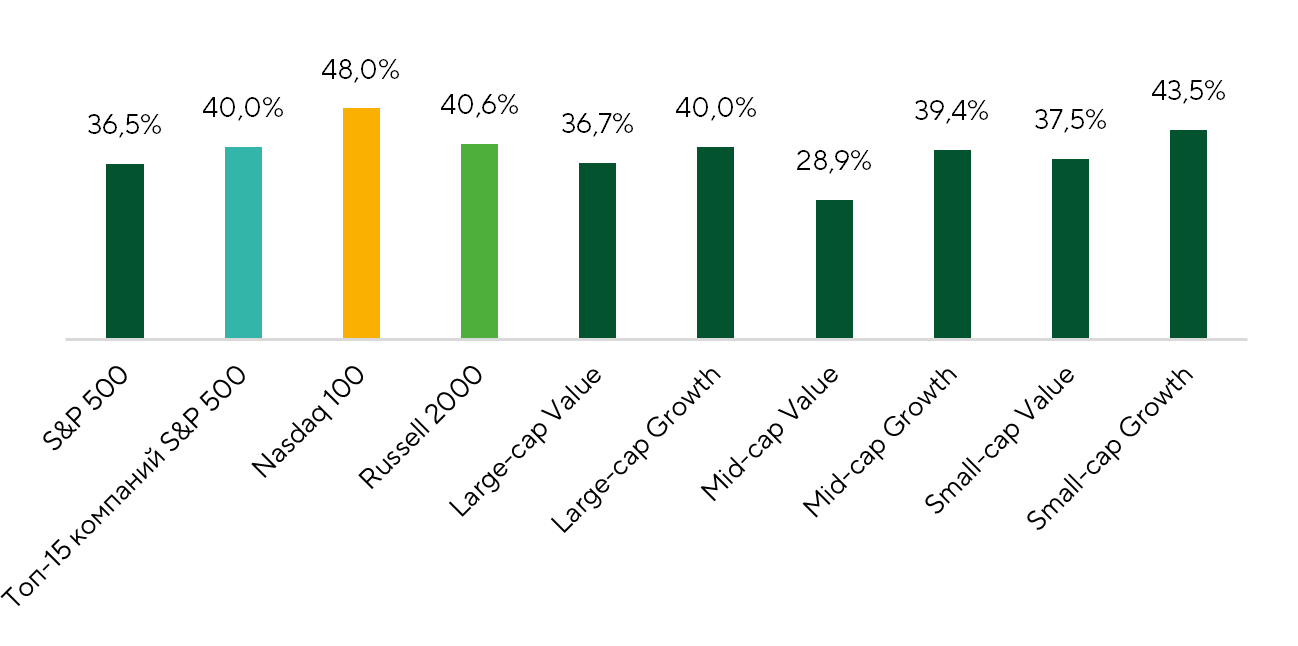
Market Breadth: Share of Companies with Positive Returns
Source: FactSet, Freedom Broker analysis
At the same time, markets appear to treat the current geopolitical shock and energy supply disruptions as temporary. So far, the escalation has had little impact on long-term economic expectations. We are not seeing a meaningful rise in long-term inflation expectations or a significant revision to earnings forecasts for U.S. energy companies. The latter serves as an important proxy for how investors assess both the likely duration of the conflict and its potential macro impact.
In recent weeks, we have also observed a decline in the correlation between oil prices and energy equities. The historical correlation between the United States Brent Oil Fund ETF (BNO) and the Energy Select Sector SPDR Fund (XLE) has typically been around 0.7, indicating broadly synchronized movements. Recently, however, it has fallen to 0.48. The divergence reflects a sharp surge in oil prices alongside a much more restrained performance in energy stocks. As a result, a noticeable commodity premium relative to energy equities has emerged, currently estimated at roughly 22%. Investors should watch how this gap closes — either through lower oil prices or a catch-up move in energy equities. The adjustment will signal how markets are pricing the duration of the conflict and its economic impact.
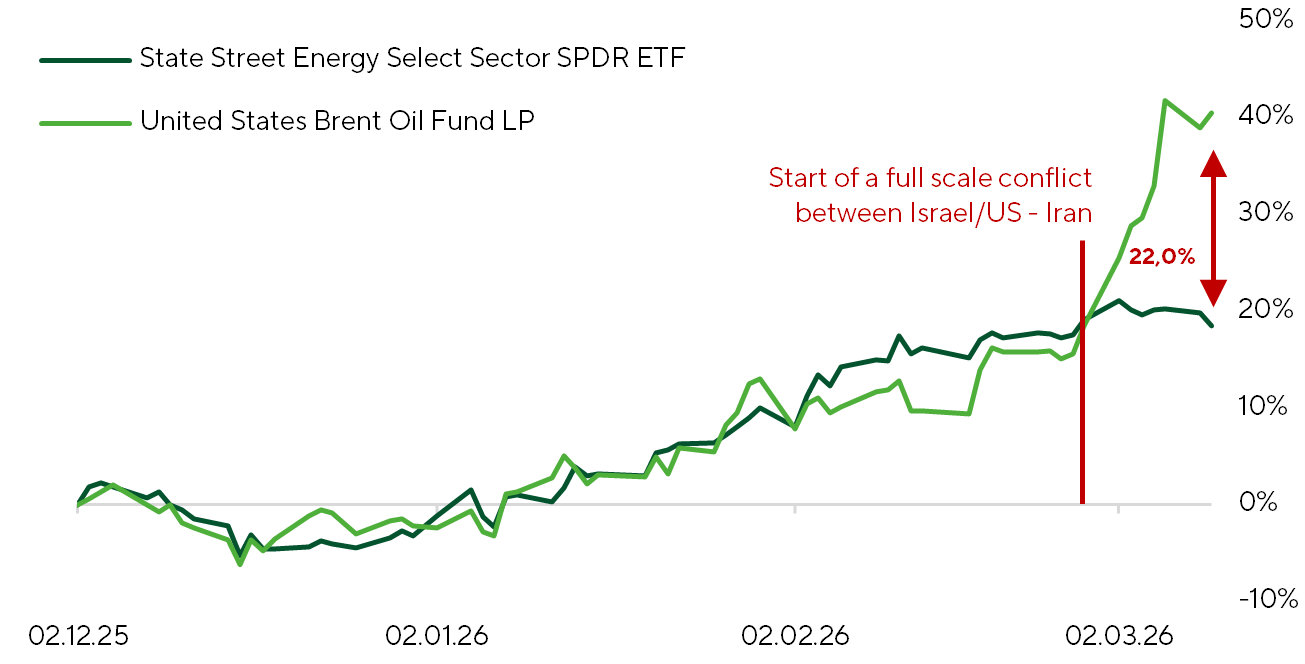
Normalized Returns of Brent Crude (BNO) and S&P 500 Energy Companies (XLE) Over the Past Three Months
Source: FactSet, Freedom Broker
In the macro data flow, several key releases stood out during the period, including January producer inflation, the February labor market report, and February retail sales.
Producer inflation data, released on February 27, showed a renewed uptick. The Producer Price Index (PPI) rose 0.48% MoM in January, while core PPI (excluding food and energy) increased 0.8% MoM. This marked the second consecutive month of elevated readings, following 0.43% and 0.59% in December. On a year-over-year basis, headline PPI has increased 2.8% since February 2025, while the core index has risen 3.6%. The main driver of the December–January increase was the Final Demand Trade Services component, which reflects retail and wholesale margins on final goods. In our view, the surge likely reflects a delayed pass-through of tariffs amid strong December demand. This component rose 1.8% MoM in December and 2.5% MoM in January. Compared with a year earlier, it increased 4.2% since February 2025, after being nearly flat during February–November 2025. At this stage, we do not see significant risks of a sustained acceleration in inflation stemming from PPI dynamics.
Labor market data for February, released on March 6, came in weaker than expected. The U.S. Unemployment Rate rose to 4.44% vs. a 4.3% consensus, while Nonfarm Payrolls unexpectedly declined by 92K, compared with expectations for a 55K increase. However, we view the negative surprise as largely temporary. The drop in payrolls was mainly driven by transitory factors, including strikes and adverse weather conditions in February.
Retail sales data for February, also released on March 6, came in mixed. Headline U.S. Retail Sales declined 0.16% MoM, sales excluding autos were flat, while the control group increased 0.35% MoM. On a year-over-year basis, sales rose 3.16% for the headline figure, 3.88% for the core measure, and 4.86% for the control group. Given the strong seasonal distortions observed in January, the report broadly aligned with consensus expectations and did not materially surprise markets.
Overall, excluding the geopolitical shock linked to Iran, the U.S. economy continues to show notable resilience, while the recent weakness in labor-market data appears largely attributable to temporary and statistical factors rather than a shift in underlying trends.
Market Focus
Over the next several weeks, investor focus will likely remain centered on the conflict involving Iran. The key question is how relevant the February macro data remain and whether they still reflect economic conditions after the start of the conflict. With oil prices up tens of percent in recent weeks and 30-day implied volatility above 100% annualized, markets are actively reassessing the likely duration of the Middle East conflict, its impact on the oil market, and potential second-round effects for inflation and the global economy.
Investors are trying to determine whether the shock could shift longer-term inflation expectations and alter the expected path of policy by the Federal Reserve. Attention will also turn to the upcoming FOMC meeting on March 17–18. Futures pricing implies a 99.3% probability that rates will remain unchanged, but markets will focus closely on comments from Jerome Powell during the press conference. In the current environment, even subtle signals on the economic outlook could shape short-term expectations and influence market direction.
At the same time, we believe the risk of a near-term oil supply shortage may be somewhat overstated. The recent surge in crude prices appears driven largely by a risk premium tied to extensive media coverage of attacks by the Islamic Revolutionary Guard Corps (IRGC) on oil and gas infrastructure in Gulf states and on tankers, the temporary halt of shipping through the Strait of Hormuz, and the initially delayed response from the International Energy Agency (IEA).
The disruption to shipping through the strait has reduced oil and petroleum exports from Gulf countries by roughly 15–16m barrels per day. On March 11, IEA member states agreed to release 400m barrels from strategic reserves to compensate for the shortfall. According to OPEC data, commercial oil and petroleum inventories in OECD countries totaled 2,824m barrels as of January 2025, with another roughly 1,500m barrels held in strategic government reserves. In theory, OECD countries alone could offset the loss of Gulf export volumes for roughly 270 days.
Additional inventories outside the OECD — primarily in China, India, and other economies — may amount to around 2,000m barrels. With effective reallocation of global trade flows, lost exports through the Strait of Hormuz could potentially be offset for more than a year.
It is also important to note that the main importers of Gulf oil have not yet physically felt the disruption. Tankers typically take about three weeks to reach Asian buyers such as China, Japan, and South Korea, and more than four weeks to reach European markets.
At the same time, the IRGC’s operational capabilities appear to have weakened in March. Available information suggests that the number of missile launches has fallen roughly tenfold compared with the first day of the conflict, while drone launches have declined about fivefold. According to the Israeli Air Force, more than 80% of Iran’s air-defense systems and over 70% of its ballistic-missile launchers have been destroyed, while strikes on facilities used to produce missiles and drones continue.
Before hostilities began, Iran reportedly possessed about 5,000 naval mines, raising concerns about potential mining of the Strait of Hormuz. However, this scenario had been anticipated in advance. Two mine-countermeasure vessels — USS Canberra and USS Santa Barbara — are currently operating in the area. In addition, Iran’s navy has reportedly lost most of its larger combat vessels and a significant portion of its smaller fleet, making a prolonged mining of the strait unlikely.
In recent days, U.S. and Israeli aircraft have also targeted facilities used by the regime to suppress domestic protests, including IRGC headquarters, command and logistics centers, Basij and police structures, and internal intelligence units. This may signal preparations for a potential ground phase of the operation once the regime’s internal security infrastructure has been weakened. In our view, domestic Iranian opposition forces could play a significant role in any potential ground phase of the conflict.
Broad Market Technical Analysis
Since early March, the technical picture for the S&P 500 has deteriorated. The 6,780–6,800 zone — which held the market twice in February — has been broken, and the index has slipped below its 100-day moving average, currently around 6,830–6,850. This weakens the short-term structure and turns the 6,780–6,850 area from support into resistance. At the same time, the index remains above the 200-day moving average near 6,570, suggesting the move still resembles a correction within a medium-term uptrend, rather than a structural reversal.
Momentum has also softened. The RSI has slipped below the neutral 50 level, though it has not yet reached oversold territory. Market breadth has deteriorated as well. The share of stocks trading above their 200-day moving average has fallen from 63–64% to 53–54%, signaling a narrower and less durable rally. Our base case for the coming weeks is sideways consolidation with intermittent rebound attempts. For a more convincing bullish impulse to return, the index would need to reclaim the 6,900–6,920 zone.
Expected Trading Range
For now, we expect the S&P 500 to trade in a 6,550–6,900 range in the near term.