Investment Review №341. The Obvious and the Unbelievable
Corporate News in Focus of Our Analysts
Delta Air Lines, United Airlines и American Airlines
During the JP Morgan conference held on March 17, airlines offered insights into the industry’s current trends. U.S. air travel demand remains robust: Delta Air Lines (DAL), United Airlines (UAL), and American Airlines (AAL) are reporting record booking weeks and double-digit revenue growth, particularly in premium and corporate segments. At the same time, a sharp rise in fuel prices has added hundreds of millions of dollars in additional costs for the industry. Big Three carriers are leaning on brand loyalty and premium products, aiming to pass a substantial portion of the fuel shock through fares, leaving the low-cost segment most exposed. United, anticipating that high oil prices will persist at least through 2027, has already announced a temporary reduction of about 5% of its schedule in Q2–Q3 2026, primarily by cutting lightly loaded, overnight, and off-peak flights, as well as reducing service through Chicago and suspending routes to Tel Aviv and Dubai. While carriers stress margin management confidence, market skepticism remains high on full pass-through of fuel cost inflation.
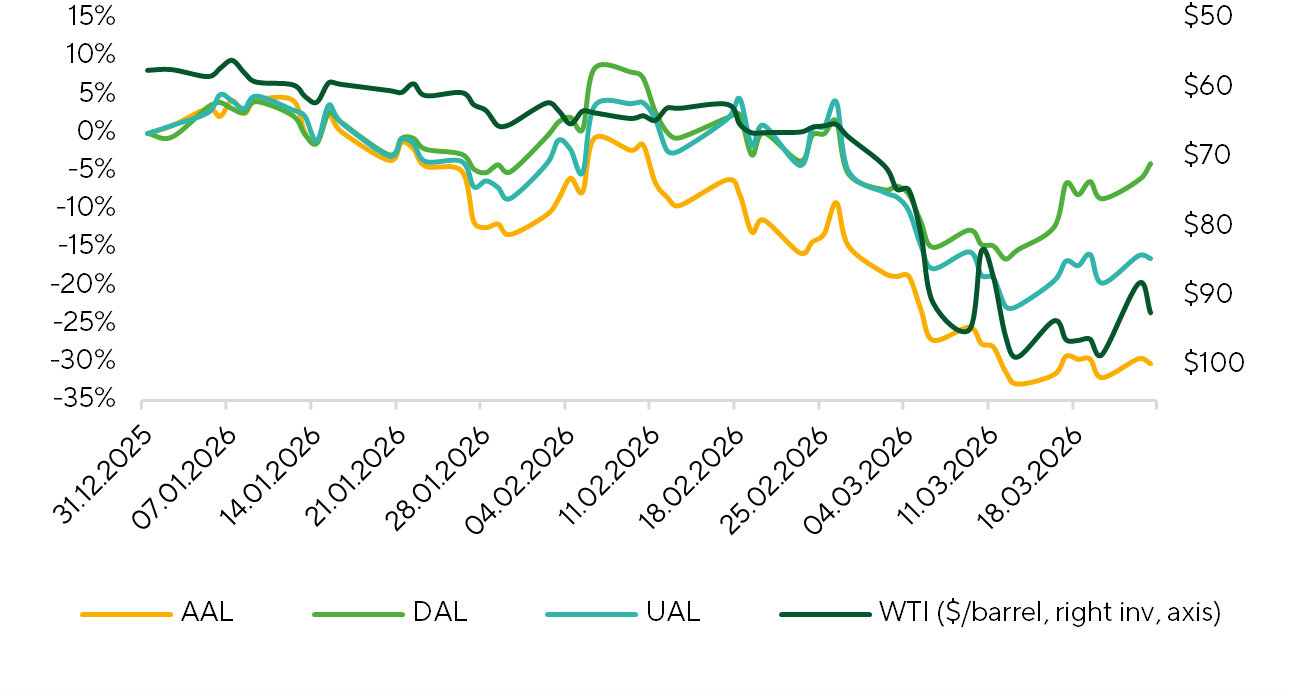
Inverse Movement of Oil Prices and Airline Stocks.
Source: FactSet, Freedom Broker
Barrick, Newmont и Agnico Eagle
Last week, the gold market experienced a historically rare event: prices dropped >10%, a move seen only five times in trading history. Gold miners’ benchmark GDX — tracking majors including Barrick (B), Newmont (NEM), and Agnico Eagle (AEM) — moved in tandem. The pullback reflects compressed multiples: NTM P/E fell to 10.3x vs. 15.0x pre-conflict and a 10Y average of 18.5x. Long-term expectations remain anchored, and 2026 financials for miners could mark the strongest performance in years.
We view gold’s investment appeal as intact despite short-term volatility.
| Best Performers | Worst Performers |
||||
| # | Date | Change (%) | # | Date | Change (%) |
| 1 | 14.01.1980 | 31,1 | 1 | 21.01.1980 | -22,8 |
| 2 | 31.12.1979 | 16,4 | 2 | 10.03.1980 | -12,4 |
| 3 | 16.08.1982 | 14,8 | 3 | 21.02.1983 | -12,1 |
| 4 | 27.09.1999 | 13,2 | 4 | 16.03.2026 | -10,6 |
| 5 | 15.09.2008 | 13,1 | 5 | 30.10.1978 | -10,2 |
| 6 | 30.08.1982 | 12,7 | 6 | 09.03.2020 | -8,7 |
| 7 | 02.06.1980 | 11 | 7 | 19.09.2011 | -8,5 |
| 8 | 28.01.1980 | 10,9 | 8 | 14.07.1980 | -8,4 |
| 9 | 05.07.1982 | 10,5 | 9 | 11.08.2008 | -8,4 |
| 10 | 16.03.1981 | 9,9 | 10 | 13.10.2008 | -8,3 |
Historical Gold Price Movements .
Source: FactSet, Freedom Broker
XLRE ETF
The XLRE ETF, representing the real estate sector within the S&P 500, has been outperforming the broader market YTD. However, since the onset of the military operation in Iran, the fund has nearly erased all of its absolute gains, amid a broader market correction and rising long-term U.S. Treasury yields. 4Q results were broadly in line to modestly ahead of expectations across constituents; however, FY26 FFO growth consensus has been revised down to 5% from 6%. Against a backdrop of muted earnings growth vs. the tech-heavy broader market and P/FFO trading broadly in line with historical averages, we see limited scope for multiple expansion.
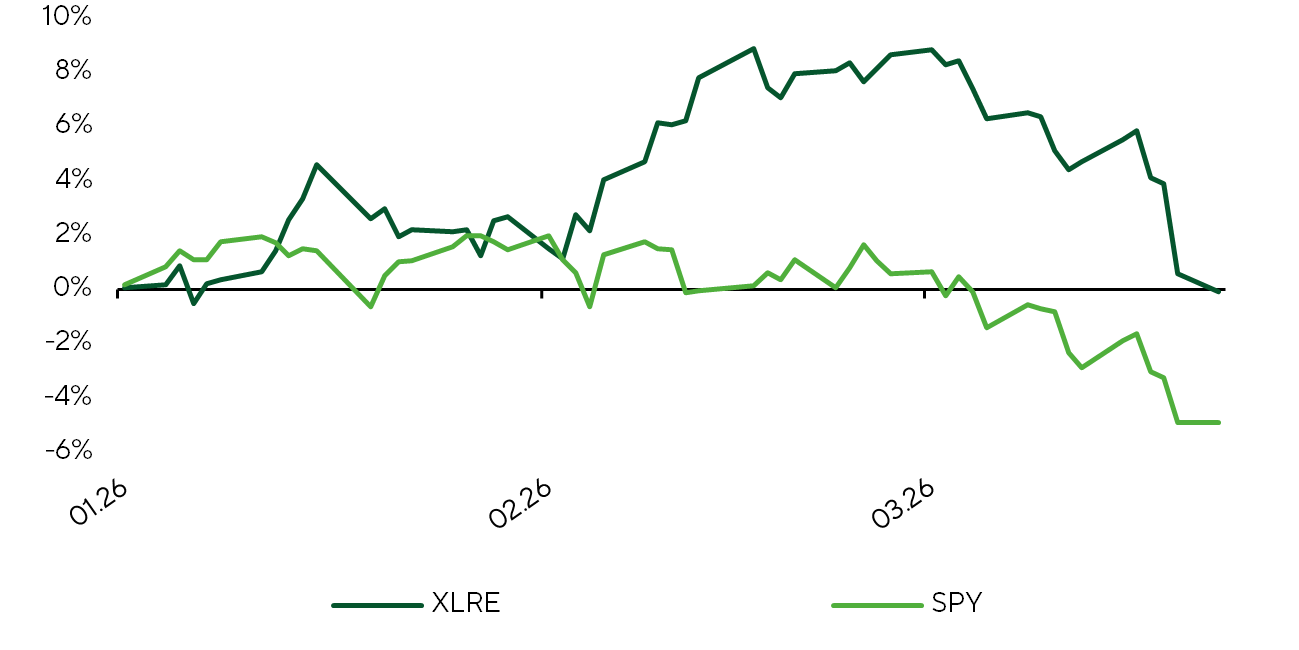
Normalized YTD Returns – XLRE vs. S&P 500.
Source: FactSet, Freedom Broker
Micron Technology
On 18 March, Micron Technology (MU) reported a staggering 2QFY26 result, handily surpassing consensus across all metrics and delivering very strong 3Q guidance. The upside was driven by unprecedented AI data-center memory demand, severe DRAM/NAND supply tightness, and aggressive pricing amidst modest volume growth. Margins hit all-time highs, with non-HBM profitability exceeding HBM, highlighting the scale of pricing power. The company also inked its first five-year Strategic Chip Agreement (SCA), underscoring the long-term nature of memory supply tightness, which is mirrored in elevated CapEx plans across the sector. Geopolitical risks are currently immaterial to the business but could compress MU’s margins by ~2pp if tensions escalate. As management notes, “timing of market rebalancing is extremely difficult to predict,” a challenge compounded by rising sector-wide CapEx and ongoing geopolitical complexity, raising questions about the sustainability of the current growth trajectory.
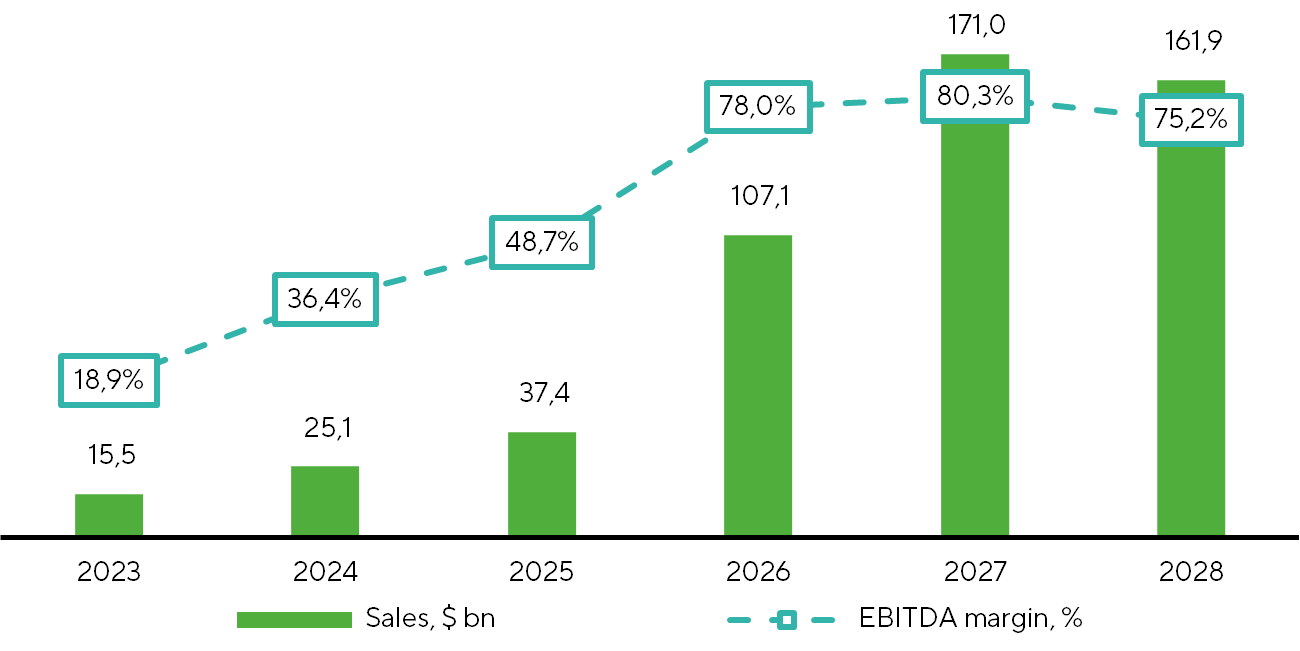
Key Financial Metrics for Micron Technology (MU).
Source: FactSet, Micron Technology, Freedom Broker
NVIDIA
The GTC 2026 conference, held by NVIDIA (NVDA) on 16–19 March, delivered a striking showcase of innovation, reinforcing the company’s aggressive expansion into AI inference amid intensifying competition with big-tech ASIC solutions. Highlights included physical AI (robotics and autonomous driving) and the emerging concept of space-based data-center infrastructure. Nvidia’s showcased solutions and announcements increasingly position the company not just as a GPU and hardware provider, but as a fully integrated infrastructure platform for AI applications across industries. The financial narrative focused on the Blackwell + Rubin market opportunity, now estimated at ~$1tn by end-FY27, excluding revenue from other data-center components (Groq LPU, CPX, CPU, networking, software, services), versus pre-conference consensus of ~$989bn for FY25–FY27. Despite the ambitious announcements, NVDA shares reacted mutedly, weighed down by macro headwinds.
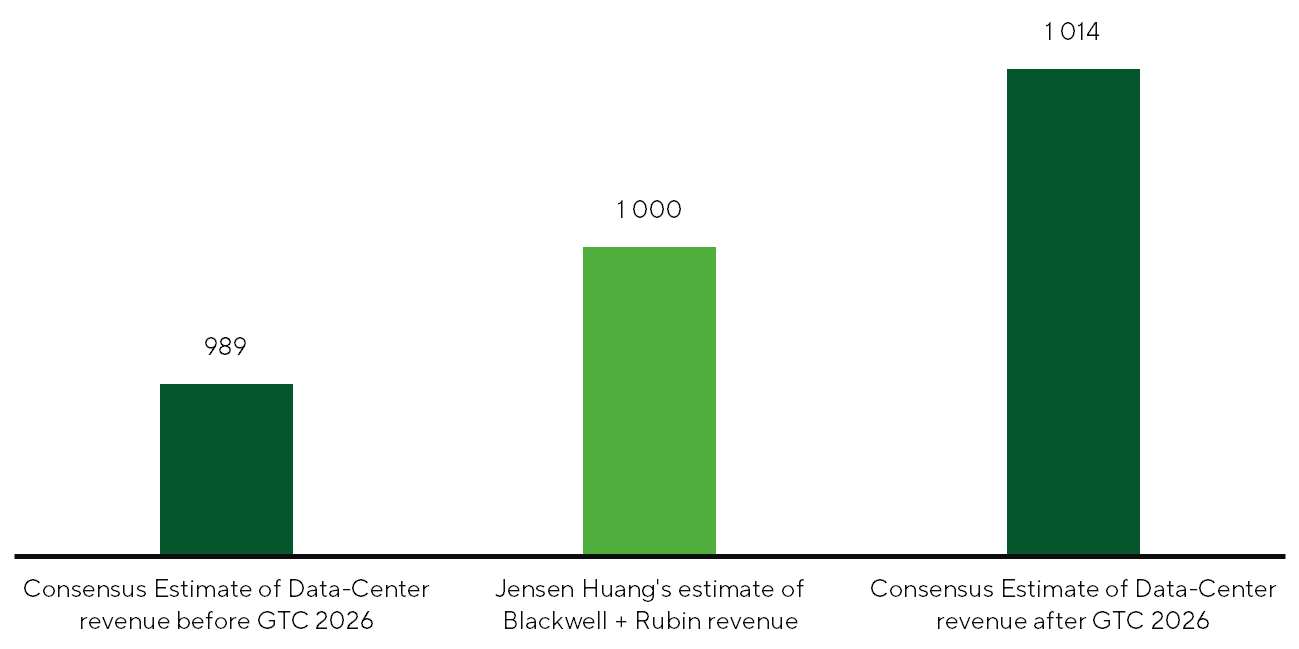
NVIDIA Corp. (NVDA) total revenue forecasts for 2025–2027, in billions of dollars.
Source: FactSet, NVIDIA, Freedom Broker