Investment Review №341. The Obvious and the Unbelievable
Review as of March 23
Global Perspective
U.S. equities remained under sustained pressure over the past two weeks, with rebound attempts proving short-lived. All major benchmarks closed in the red. The S&P 500 fell 3.2%, the Dow Jones Industrial Average declined 3.2%, and the Nasdaq-100 dropped 3.1%. Small caps showed relative resilience, with the Russell 2000 down 2.3% and the S&P SmallCap 600 off 1.8%. Market internals weakened further. The share of advancing stocks within the S&P 500 dropped to 17.3% (–19.2pp), implying 417 constituents declined, with a median loss of 3.6%. The signal is clear: selling pressure is broadening, not concentrating.
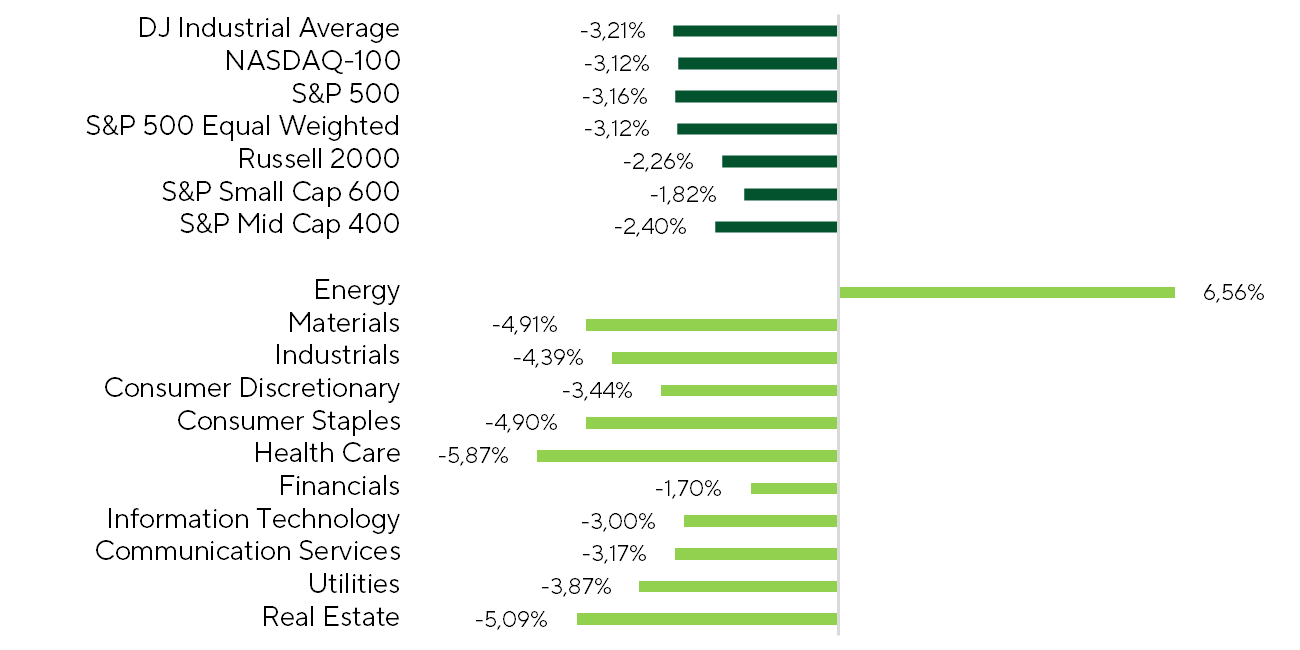
S&P 500 Benchmark and Sector Performance (Two Weeks).
Source: FactSet, Freedom Broker analysis
Energy was the sole outperformer, gaining 6.6%, with investor interest supported by a persistent geopolitical premium in oil prices, despite elevated volatility. Consensus is now shifting toward a more constructive earnings outlook for the sector. Prior to the conflict, the market was pricing in a modest contraction in 2026 EPS (–0.1% YoY). That view has since been revised higher, with expectations now pointing to +5.1% YoY growth. If oil remains structurally elevated, further upside in energy equities remains plausible.
A brief rebound on March 23 underscored the market’s extreme sensitivity to geopolitics. Statements from Donald Trump regarding productive talks with Iran and a temporary five-day pause in strikes on Iranian energy infrastructure contributed to a partial easing of tensions and a recovery in risk assets. On the day of these headlines, the S&P 500 closed 1.2% higher, while Brent crude prices saw a sharp intraday correction of 9.5%. This price action effectively signaled a market repricing of potential de-escalation, providing short-term support for risk appetite.
However, the broader backdrop remains subdued, with markets still characterized by elevated volatility. We are seeing a sharp pickup in cross-asset implied volatility, signaling that investor anxiety is no longer confined to a single asset class but is spilling across the global financial system. Implied volatility is rising simultaneously across equities, bonds, commodities, and even traditional safe havens such as precious metals. This points to a shift into a more stressed market regime, where risks are becoming systemic rather than localized. In this environment, cross-asset synchronization increases, correlations rise, and diversification benefits erode. Assets that would typically offset each other are now moving in tandem. As a result, the probability of tail events increases, arguing for more cautious positioning, with a stronger emphasis on liquidity and explicit hedging strategies.
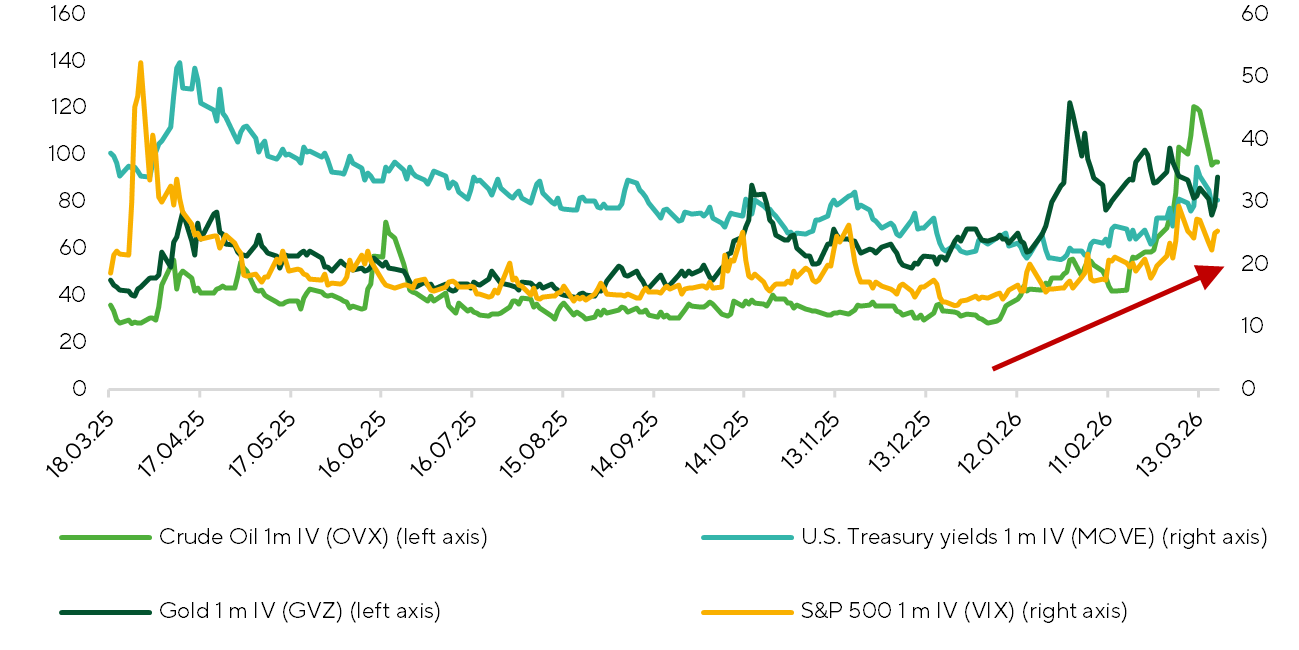
Cross-Asset Implied Volatility Trends.
Source: FactSet, Freedom Broker
Precious metals warrant particular attention, having posted sharp declines over the period. Gold and silver fell 14.5% and 20.2%, respectively. At face value, this move appears counterintuitive, given elevated geopolitical tensions and mounting inflationary pressures.
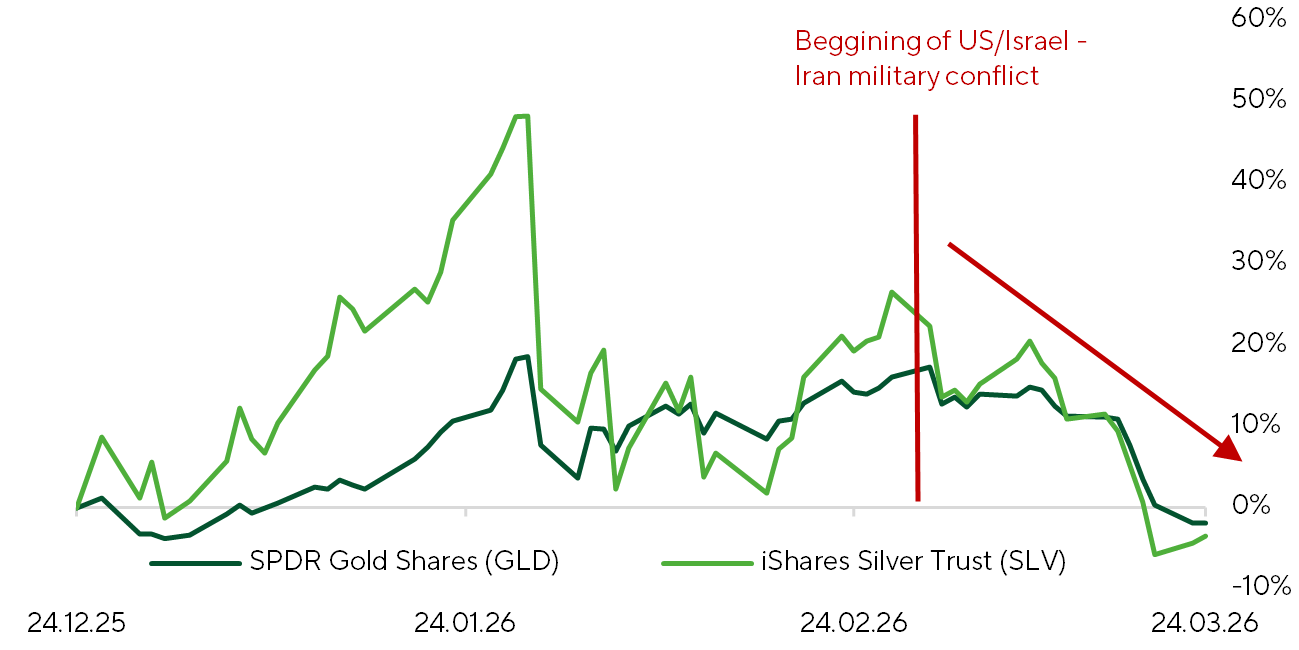
Gold (GLD) and Silver (SLV) Normalized Returns (3 Months).
Source: FactSet, Freedom Broker
In our view, the recent drawdown reflects a confluence of factors rather than a single narrative, with the conflict in Iran acting more as a catalyst than a primary driver. The dominant forces have been liquidity and portfolio rebalancing. March saw significant outflows from gold ETFs, while tighter margin requirements introduced earlier this year by the Chicago Mercantile Exchange added pressure after previously fueling a short squeeze. At the same time, the rally in energy prompted a rotation of capital into oil, while rising yields on U.S. Treasuries and expectations of tighter Fed policy increased the relative appeal of fixed income, reinforcing outflows from gold.
Notably, this has been occurring alongside a decline in exchange inventories in the U.S. and China, pointing to resilient physical demand. The outlook for gold can be framed through two scenarios:
- In a prolonged conflict, the inflation impulse would likely support safe-haven demand.
- In a de-escalation scenario, demand would be underpinned by central bank purchases, a weaker dollar, and solid retail demand.
In both cases, the long-term investment case for gold remains intact, despite elevated near-term volatility.
On the macro front, investor attention has shifted back to the Federal Reserve, with developments unfolding along two axes: the outcome of the March meeting and the evolution of rate expectations.
At the March 17–18 FOMC meeting, the Fed left the policy rate unchanged at 3.5–3.75%, in line with expectations, with unanimous support from committee members. The statement struck a familiar tone: activity remains solid, job growth is moderate, unemployment is stable, and inflation is still elevated. At the same time, the Fed flagged heightened uncertainty, including the unclear impact of developments in the Middle East.
Market Focus
It is important to note that rising uncertainty about the inflationary impact of the recent oil shock is already being priced by markets and unsettling investors. Near-term inflation expectations have moved sharply higher: 1-year inflation expectations (factored in swaps) have risen 64 bp over the past two weeks to 3.4%. Medium-term (3- and 5-year) measures have also edged up, while long-term expectations remain broadly anchored. In the coming weeks, we expect the market to focus on whether inflation pressures broaden and become embedded in longer-term expectations. Any signs of spillover or de-anchoring would likely prompt a more pronounced market reaction.
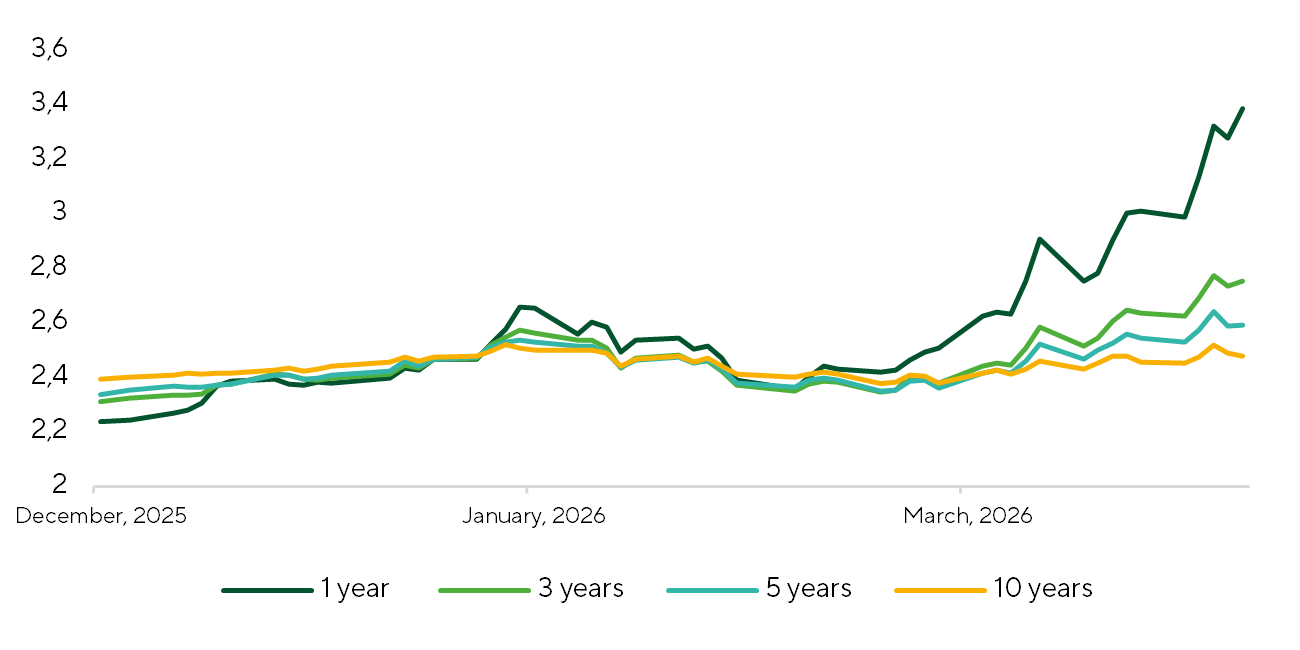
Inflation Swap-Implied Expectations (1-, 3-, 5-, and 10-Year Horizons).
Source: FactSet, Freedom Broker
Importantly, the recent uptick in short term inflation expectations and the hawkish repricing of Fed policy have not translated into downgrades to 2026-2027 U.S. growth or S&P 500 EPS forecasts. This suggests investors remain confident that the macro backdrop and corporate earnings can withstand external shocks.
Market performance will also hinge on developments in the Middle East and the trajectory of energy prices. In the current environment, a scenario based approach is most appropriate. The tensions around the Strait of Hormuz create a wide range of outcomes for oil and the global economy—from a brief shock to a prolonged phase of demand destruction. The decisive variable is the duration of any blockage, which will determine whether the market can bridge the gap through inventory drawdowns or be forced into a sharper price adjustment.
In the base case—and still most likely—scenario, the disruption is temporary, lasting 1-2 months. The resulting supply shortfall, approximately 11-13% of global consumption, is partially offset by rerouted flows and drawdowns of strategic and commercial inventories. In this case, the oil market faces only a brief deficit: prices may spike to $100-130 per barrel but should gradually normalize as logistics are restored. The economic impact is contained—the inflation impulse is temporary, and global growth remains resilient.
However, if the disruption lasts three months or more, the market structure changes materially. Despite sizable strategic stockpiles (around 8.2 billion barrels), drawdowns are constrained by both technical and political limits. Even after accounting for incremental production outside the region, a supply shortfall remains substantial—up to 6-7 mb/d over a six-month horizon. As a result, the market gradually exhausts the scope for non-price offsets. At this stage, price pressures arise. With demand elasticity near -0.1, even a partial shortfall can trigger a sharp, non-linear increase in prices. This supports the potential for oil to trade in the range of $130-150 per barrel even without an extreme scenario. The key inflection point arrives when inventories can no longer bridge the deficit. At that point, the market shifts to a demand-destruction regime: prices must rise enough to force consumption to shrink by the amount of lost supply. Given the structure of global demand, the burden falls primarily on net importers—OECD economies, China, and the rest of Asia—who will be compelled to reduce consumption through economic slowdown, resource reallocation, and higher costs.
In an extreme scenario, prices could spike above $200 per barrel, fueling faster inflation, slower GDP growth, and tighter monetary policy. In this context, oil becomes more than a commodity; it functions as a mechanism for redistributing global demand and directly shaping macroeconomic dynamics.
On the military front, over the past week the U.S. has taken steps to reduce transit risks in the Strait of Hormuz. Military infrastructure on Iranian islands in the Persian Gulf and the strait has been struck. U.S. attack helicopters and A-10 Thunderbolt II attack aircraft are now patrolling over the Persian Gulf and the Strait of Hormuz, with a primary mission of neutralizing IRGC war motorboats.
Preparations are also underway for potential ground operations. The amphibious assault ship Tripoli, carrying the 31st Marine Expeditionary Unit with more than 2,000 marines, has been redeployed to the region. Tripoli is embarked with a squadron of F-35 fighter jets, transport and attack helicopters, tiltrotor aircraft, armed drones, and a complement of armored vehicles and artillery that can be employed in ground operations. The 11th Marine Expeditionary Unit, embarked with the Boxer Amphibious Ready Group led by the flagship USS Boxer, has also been deployed to the Middle East. The group adds more than 2,000 Marines, along with attack and transport helicopters and tiltrotor aircraft. A defining capability of the Boxer-class ship is its well deck, which enables the launch and recovery of landing craft—including LCAC hovercraft—and amphibious vehicles, facilitating ship-to-shore operations. Also moving into the region is at least one brigade from the 82nd Airborne Division. One brigade typically includes about 4,000 soldiers and is trained for rapid deployment to seize key terrain, notably airfields.
A principal mission for these marine and airborne forces could be securing islands administered by Iran in the Persian Gulf and the Strait of Hormuz. A parallel development could be coordinated offensives by Kurdish armed groups in northwestern Iran along the Iraqi border, which could involve up to 10,000 fighters; Iran itself is home to as many as 10 million Kurds. A second actor is the Baloch insurgency (up to roughly 2,000 fighters), which primarily targets IRGC and Basij checkpoints through attacks, ambushes and sabotage. The third line of effort is the activation of small armed resistance cells organized by Israeli and U.S. operatives and trainers across Iran. These groups may include military and police officers who have defected from the clerical regime to the opposition. Their primary focus would be attacking IRGC and Basij checkpoints, conducting ambushes, and carrying out sabotage.
Seizing the islands would significantly reduce Iran’s ability to detect and attack tankers. Complementary combat operations on the Iranian mainland would eliminate, within territories controlled by the “resistance forces,” the capacity to produce, store, and employ missiles and drones.
Technical Broad-Market Analysis
The S&P 500 remains in correction mode. The technical damage became more apparent after the index closed below its 200-day moving average for the first time in a year late last week. That moving average is now likely to cap any rebound, creating a strong resistance band near 6,620-6,650 over the next couple of weeks. While prices remain below this zone, short-term bearish momentum prevails. The RSI is still in oversold territory; if the sharp decline eases, a period of consolidation is more likely than an immediate reversal. If an attempted breakout above 6,620-6,650 fails, the next downside objective is 6,350, with risk of a brief undershoot toward 6,140. We would only infer that the market has the strength for a durable reversal once 6,620-6,650 is decisively reclaimed, which would open scope for an advance toward a resistance zone of 6,780-6,830.
Expected Trading Range
The S&P 500 is most likely to move between 6,470 and 6,650.