Investment Review №333. Right to hedge
Review as of November 17
Global Perspective
Over the past two weeks, the major U.S. equity indices have moved lower. The S&P 500 lost 2.6%, the Nasdaq 100 decreased by 4.5%, while the main laggard was the small-cap Russell 2000, which fell 5.2%. A reassessment of the likelihood of a rate cut in December forms a very cautious market sentiment regarding the small equity segment. The only benchmark to post gains was the DJ Industrial Average, which added 0.9% over the period. Whereas from late October to early November the primary drivers of market gains were mega-cap names, the past two weeks have been characterized by profit-taking and sector rotation. The main beneficiary of this shift was Health Care, which outperformed the S&P 500 by 7.6% for the period.
Excess returns of major US stock indices
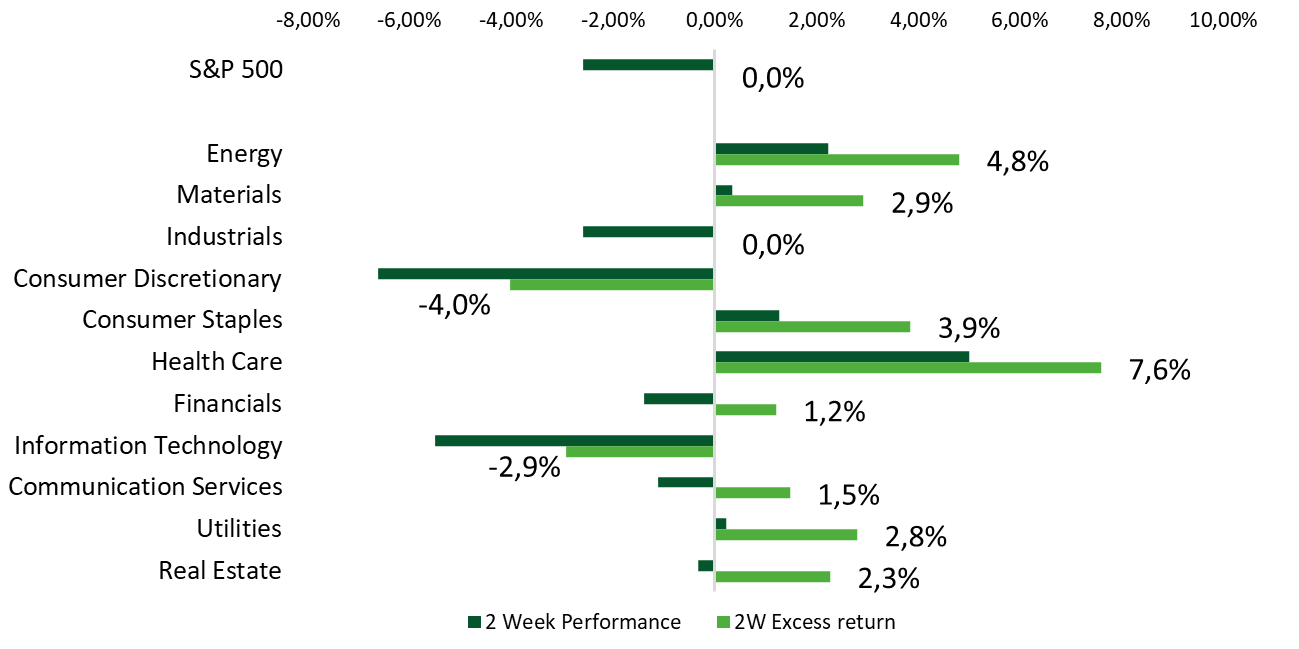
Источники: FactSet, Freedom Broker
The sharpest sell-off during the “subdued” rotation was concentrated in the overheated AI niche. Based on market breadth—the proportion of constituents with positive returns—only 12.7% of S&P 500 IT companies posted gains over the period. In the broader, tech‑heavy Nasdaq‑100 index, just 32.4% of constituents were up. Pressure was most acute in names that had rallied for an extended period on AI enthusiasm: PLTR: -17.3%, ARM: -16.8%, INTC: -12.1%, NVDA: -9.8%, QCOM: -7.7%, AMD: -7.4%, among others. Most companies of the mega-cap “Magnificent Seven” also lagged: TSLA: -12.7%, AMZN: -8.3%, META: -5.6%, MSFT: -1.8%, AAPL: -0.6%.
Even so, a key support for the market is the still-robust underlying demand for AI, which continues to bolster long-term valuation growth. In their Q3 reports, some companies cited “insatiable” demand for AI compute and increasing orders for related hardware. AMD estimates the AI chip market at roughly $1 trillion by 2030 and expects to capture a meaningful share of that revenue. Cisco pointed to record AI infrastructure bookings and double-digit growth in product orders. Amid this, some investors view the current phase as more akin to the early phase of the late-1990s tech cycle than the final stage of a bubble and see the present pullback as a positioning reset rather than the end of the theme. Importantly, IT valuations remain anchored to earnings expectations, which have not yet shown cooling.
Market Breadth: Share of companies with above-zero return
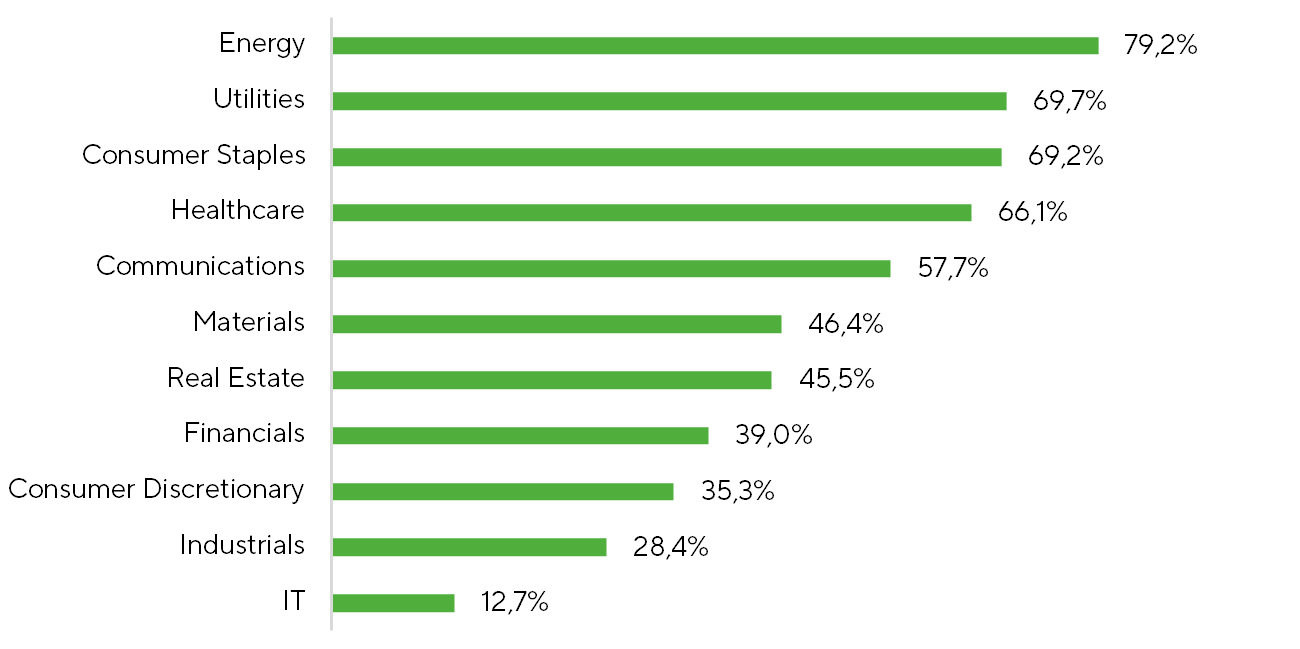
Источники: FactSet, Freedom Broker
On the contrary, several defensive niches emerged as key beneficiaries of the latest capital rotation. According to market-breadth metrics, the Energy sector saw the broadest rebound, with roughly 80% of XLE constituents advancing. There was no significant news to explain the synchronous move. The rally was likely driven by a shakeout market rotation out of overheated niches and into beaten-down S&P 500 companies, including the Energy sector—which, on a three-year horizon, has been the weakest-performing sector (XLE: −1.41%). Other beneficiaries of the rotation included Utilities, Consumer Staples, Health Care, and parts of Communication Services—classic havens for capital during periods of elevated market turbulence.
Powell set the stage for a shift in sentiment after the late-October FOMC meeting by stating that the regulator’s policy was not on “autopilot.” Over the subsequent two weeks, several Fed officials adopted a bit more hawkish tone, leaving the market highly sensitive to any incoming data. In public remarks, they emphasized that inflation remains the primary risk and that room for further rate cuts is limited. This hawkish tilt weighed on market sentiment and pushed the likelihood of an on-hold outcome at the December meeting toward 50%, up from near 0% a month before.
Another market theme was the end of the federal government shutdown. On Wednesday, November 11, President Trump signed legislation previously approved by Congress and the House of Representatives, ending the longest shutdown in U.S. history that lasted 43 days. For investors, the key implication is the resumption of official macroeconomic releases; without them, it is hard to assess the state of the economy. However, several fall data releases were canceled or postponed, and collection of some price and employment indicators was disrupted. As a result, both investors and the Fed have fewer hard numbers to rely on, and the market is reacting more sharply to those reports that still appear. The delays, in turn, have weighed on sentiment.
Besides, in the lack of BLS labor-market data, the ADP private payrolls estimate drew more attention. The overall labor market picture remains mixed: during the four weeks through October 25, private employers added an average of about 10.5k jobs per week versus expectations of only 6.25k. This suggests some recovery in labor demand and, in turn, raises the odds that the Fed will leave rates on hold, given it had previously cut it to support a cooling labor market.
On the corporate front, the Q3 earnings season is nearing completion in the large-cap segment, with more than 92% of S&P 500 companies having reported. Near-final aggregate results point to continued momentum in U.S. corporates, with EPS up 13.1% y/y, compared to 12.7% two weeks ago. This resilience provides a solid foundation for further EPS growth into 2026 and is supportive for equities.
In the small-cap segment, the season is also wrapping up, with 93% of S&P Small Cap 600 companies having reported. Aggregate EPS increased 10.5% y/y—the second quarter of double-digit revenue growth—underscoring sustained momentum and a recovery from a prolonged earnings recession. However, amid the heightened sensitivity to expectations for the Fed’s future interest rate path, the market is largely discounting these improving fundamentals.
Market Focus
Over the next two weeks, the key focus for investors will be how quickly the macro data release calendar normalizes. Despite a crowded schedule, the risk of further delays remains elevated, so we are treating the release calendar with caution.
The second estimate of Q3 GDP is slated for November 26. However, the absence of the first estimate raises the likelihood of a postponement. Even so, we expect an initial economic growth print by month-end. Our estimates put annualized U.S. GDP growth for the quarter at roughly 3.5%.
The October PCE deflator will be released on the same day. That data will almost certainly also be delayed, as the underlying price survey was not conducted in October. The Bureau of Labor Statistics (BLS) is grappling with a complex task—it will most likely need to fully process the November measurement, while simultaneously publishing an October estimate that partly interpolates between September and November. This will inevitably reduce data quality, but the agency has no alternative.
The November CPI is slated for release on the morning of December 10, the same day as the Fed’s rate decision. Timely publication is important, but a delay is possible given the later start to the November survey due to the prolonged shutdown. Any slippage would lower the odds of a December rate cut and tilt expectations toward a hold. In a data-scarce environment, the Fed may indeed prefer to keep rates unchanged.
There was no household employment survey in October either, which is the basis for the unemployment rate calculation. The BLS will probably rely on the November survey, currently scheduled for release on December 5, though this too could be delayed. By contrast, payroll-based employment statistics for October and November are relatively straightforward to compile, so those data should still be available timely by late November and early December.
Over the next month, as the backlog of macro releases clears, the picture of the economy should become much clearer. In our view, this clarity will ease some of the pressure on market sentiment and may be an important pivotal point for the market.
Another focal point for the market will be the corporate calendar: while earnings season is drawing to a close, several companies that are of particular interest in the current environment will release their reports.
On December 2, CrowdStrike (CRWD), a leader in cybersecurity, is scheduled to report Q3 results. CRWD shares have lost some momentum amid ongoing profit-taking across the IT sector but still demonstrate a strong year-to-date gain of more than 50%. Last quarter, the company’s subscription revenue growth accelerated, new annualized recurring revenue (ARR) reached a record, and cash flow hit all-time highs. Q2 signaled a clear recovery in demand for cybersecurity and platform consolidation, reinforcing CrowdStrike’s position as a key beneficiary of enterprises’ shift toward comprehensive defense solutions. Management expects CRWD to maintain roughly 20% year-over-year revenue growth in Q3, continue ARR expansion, and sustain high subscription gross margins. Sustainable cash generation, customer base expansion, and contributions from new Falcon platform modules set the stage for another beat of earnings guidance. Despite this, we maintain a neutral stance ahead of the print, as much of the good news appears already priced in, and the ongoing market skepticism about the IT sector is an additional factor of pressure.
Dollar General (DG), the largest discounter chain in the U.S., is expected to report Q3 results on December 4. Shares are exhibiting strong momentum just before the print, outperforming the U.S. consumer staples peer group by more than 38% year to date. Over the past three quarters, DG has exceeded EPS consensus by an average of 16.5%. For Q3, management expects moderate comparable sales growth of approximately 2-3%, driven by higher traffic and a stabilizing average purchase amount. Operating expense pressure is likely to persist due to large-scale store remodel and refresh programs, although early benefits thereof are already evident in improved traffic trends. Overall, DG is well positioned to deliver better operating performance and potentially beat earnings expectations, supported by more efficient goods turnover and disciplined cost control. We view the upcoming results as neutral-to-positive, and our price target for DG remains under review.
Technical Broad Market Analysis
The technical setup for the S&P 500 looks mixed. The index has slipped below its 50-day moving average, which is undermining the buyers’ position, and the RSI also points to strengthening bearish momentum. At the same time, the proportion of companies trading above their 200-day moving average remains just above 50%, indicating that there is no structural weakening in the trend. We still see a resumption of the uptrend as the base case scenario. However, the outlook may deteriorate if the index breaks below 6,550 points and consolidates beneath that level.
Expected Trading Range
We anticipate the S&P 500 index to move within a range of 6,400-6,850 points.