Investment Review №334. Customer return

Vadim Merkulov
Head of Analytics department
DXP Enterprises. Riding the wave
Modernization of industrial infrastructure in the US will ensure DXPE shares reach their target
О компании
DXP Enterprises, Inc. (DXPE-US) is a leading US industrial distributor focused on maintenance, repair, and operations (MRO) solutions for the oil and gas, water and wastewater, chemical, manufacturing, construction, and power generation markets. The company offers a broad portfolio of products and services, including pumps and other rotating equipment, bearings and power transmission systems, metalworking supplies, and industrial safety means and services.
| Ticker | DXPE |
| Share price as of analysis | $96,50 |
| Target share price | $121 |
| Growth potential | 25,4% |
| Share price dynamics vs. indices | Day | Week | Month | Quarter | Year |
| DXPE | 4,1% | 3,3% | (19,3%) | (20,5%) | 31,0% |
| S&P 500 | 0,2% | 0,9% | (0,2%) | 6,5% | 12,9% |
| Russell 2000 | (0,2%) | (0,0%) | (0,6%) | 4,8% | 1,3% |
| DJ Industrial Average | 0,4% | 0,8% | (0,2%) | 4,8% | 6,0% |
| NASDAQ Composite Index | 0,6% | 1,7% | (1,3%) | 10,0% | 20,7% |
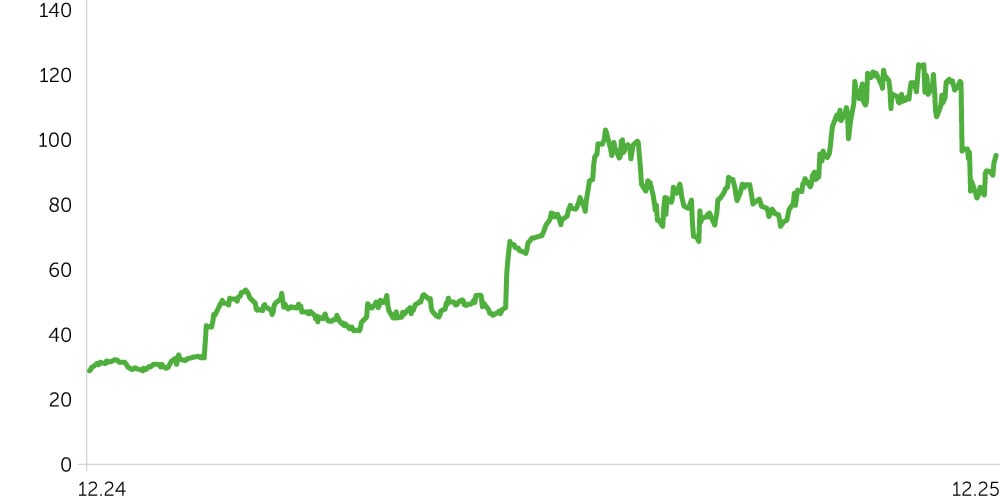
Price dynamics DXPE, $
Key Investment Thesis
- Structural growth in US infrastructure and industrial markets. A multi-year reindustrialization and infrastructure renewal cycle is underway in the U.S., supported by large government programs, private capital, and the ongoing localization of production. In 2025, more than $238 billion was invested in the construction and modernization of manufacturing infrastructure, indicating a sustained shift of capital toward the real economy rather than a one-off surge. These projects are highly capital-intensive and involve long-lived assets, which structurally increases demand for ongoing maintenance, repair, and operations (MRO) support. A distinct tailwind for DXPE’s pumping business is the US water infrastructure renewal cycle. The ASCE estimates total investment needs in potable water and wastewater / stormwater systems at roughly $1.65 trillion for 2024–2033 (about $670 billion for potable water and $983 billion for waste- and stormwater), with a significant portion still unfunded. Even partially closing this gap would likely accelerate the construction and modernization of pumping stations, water treatment plants, and wastewater facilities.
- M&A-driven strategy in the pumps business. DXP is building scale in the pumps and compressors segment through a suite of small, but regular acquisitions. In recent years the company has consistently closed several deals annually, and year-to-date it has already acquired five businesses, expanding its footprint in water, wastewater, and adjacent industrial niches. These acquisitions are integrated into the Innovative Pumping Solutions segment, now a key growth engine and a demand catalyst for the company’s MRO line. Each sold or engineered pump package converts into a multi-year stream of revenue from maintenance, parts, and upgrade, increasing the share of recurring revenue and enhancing the durability of the model.
- Attractive valuation and technical setup. Following the recent pullback, DXPE trades at roughly 14x NTM P/E versus ~20x previously, representing a notable discount to both its own history and peers (XYL at ~23x, GWW at ~22x), despite solid top- and bottom-line growth. Technically, the stock looks constructive: after the broader market rebound, DXPE shares held long-term trend support and advanced in an impulsive move, which, in our view, increases the probability of further upside.
We see roughly 25% upside in DXPE stock to our $121 price target. We rate the shares “Buy” and recommend a stop-loss around $80.
| Ratio Analysis | 2022А | 2023А | 2024А | 2025E | 2026E | 2027E | 2028E | 2029E |
| ROE | 0% | 18% | 18% | 20% | 24% | 23% | 21% | 20% |
| ROA | 0% | 6% | 6% | 6% | 8% | 8% | 8% | 8% |
| ROCE | 10% | 14% | 8% | 14% | 15% | 15% | 15% | 14% |
| Sales/Assets | 0,0x | 4,5x | 4,5x | 4,4x | 4,2x | 3,7x | 3,2x | 2,8x |
| Interest Coverage | 3,4x | 2,6x | 2,3x | 3,1x | 4,1x | 4,2x | 4,4x | 4,6x |
| Margins, % | 2022A | 2023A | 2024A | 2025E | 2026E | 2027E | 2028E | 2029E |
| Gross margin | 28% | 30% | 31% | 32% | 32% | 32% | 33% | 33% |
| EBITDA margin | 7% | 8% | 8% | 9% | 9% | 10% | 11% | 11% |
| Net profit margin | 3% | 4% | 4% | 5% | 6% | 6% | 7% | 7% |
| Financials, $mln | 2022А | 2023А | 2024А | 2025E | 2026E | 2027E | 2028E | 2029E |
| Revenue | 1 481 | 1 679 | 1 802 | 2 018 | 2 210 | 2 365 | 2 555 | 2 756 |
| Cost of goods sold | 1 059 | 1 173 | 1 246 | 1 378 | 1 500 | 1 597 | 1 716 | 1 841 |
| Gross profit | 422 | 506 | 556 | 640 | 710 | 768 | 839 | 915 |
| SG&A | 325 | 367 | 411 | 464 | 503 | 532 | 569 | 606 |
| Operating profit | 98 | 139 | 145 | 177 | 207 | 236 | 271 | 309 |
| Interest expense (income) | 29 | 53 | 63 | 57 | 50 | 56 | 61 | 67 |
| Profit before tax | 66 | 87 | 85 | 122 | 159 | 183 | 211 | 243 |
| Tax | 18 | 18 | 15 | 31 | 33 | 38 | 44 | 51 |
| Net profit | 48 | 69 | 70 | 91 | 126 | 145 | 167 | 192 |
| Earnings per share (diluted) | $2,47 | $3,89 | $4,22 | $5,51 | $7,41 | $8,47 | $9,74 | $11,18 |
| Dividend per share | - | - | - | - | - | - | - | - |