Investment Review №346. Riding the Green Wave

Vadim Merkulov
Head of Analytics department
Digital Realty Trust: The Foundation for AI Infrastructure Growth
DLR Shares Offer Attractive Upside with a Target Price of $223
About company
Digital Realty Trust (DLR) is one of the world's largest publicly traded data center REITs, owning and operating a global portfolio of 309 data centers across more than 55 metropolitan areas. The company serves a diversified tenant base that includes hyperscale cloud providers, telecommunications carriers, financial institutions, and other enterprise customers. Its offering spans large-capacity leasing above 1 MW, 0–1 MW colocation, and interconnection services, with 1 MW+ leases accounting for most of the annualized rent.
| Ticker | DLR |
| Share price as of analysis | $190 |
| Target share price | $223 |
| Growth potential | 17,4% |
| Share price dynamics vs. indices | Day | Week | Month | Quarter | Year |
| DLR | (0,7%) | (1,1%) | (2,3%) | 7,2% | 10,3% |
| S&P 500 | 0,2% | 1,4% | 6,2% | 10,2% | 28,2% |
| Russell 2000 | (0,6%) | 1,7% | 6,6% | 10,9% | 40,7% |
| DJ Industrial Average | 0,7% | 0,9% | 4,4% | 4,2% | 20,9% |
| NASDAQ Composite Index | 0,2% | 2,4% | 9,3% | 19,0% | 40,7% |
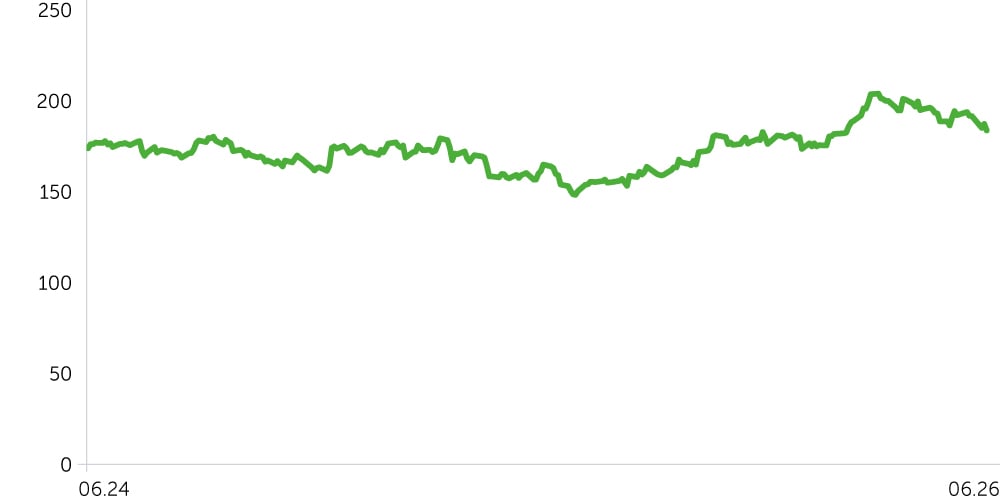
Price dynamics DLR, $
Key Investment Theses
AI demand is translating directly into bookings and backlog growth. The company delivered its second-highest bookings quarter at $423M (DLR share), including a record 200 MW inference-oriented lease with an investment-grade hyperscaler in Charlotte. The 0–1 MW and interconnection segments maintained strong momentum, with bookings reaching a third consecutive quarterly record of $98M (~21% AI-driven), supported by record activity in the Americas and strength in the largest capacity band. Total backlog on a DLR-share basis rose 26% QoQ to $1.03B, of which $544M is expected to commence over the remainder of 2026, $247M in 2027, and $242M in 2028 and beyond.
Supply constraints support pricing and rent growth. Power, equipment, labor, and community pushbacks are limiting new capacity additions and keeping pricing tight. Management raised 2026 renewal rate growth guidance to 6.5% to 8.5% on a cash basis (vs. 6.0%–8.0% previously) and 9.5% to 11.5% on a GAAP basis (vs. 8.5%–10.5% previously). Furthermore, we believe a meaningful portion of DLR's 1 MW+ leases remain priced below market, with rollovers providing an additional tailwind to revenue growth.
Capacity additions lock in earnings growth. In Q1'26, DLR spent $910M on development CAPEX and delivered 63 MW of new capacity (84% pre-leased), while starting 464 MW of new data center capacity (50% pre-leased), increasing total development to 1.2 GW under construction (61% pre-leased). Expected yields of roughly 11.4% remain well above funding costs, preserving an attractive spread despite higher build costs. The pipeline should support NOI and FFO growth as projects commence and stabilize.
AI-driven demand creates a durable backdrop. Bloomberg Intelligence estimates that 2026 capex from Amazon, Microsoft, Alphabet, Meta, and Oracle could reach about $700B, as AI infrastructure spending continues to scale. McKinsey projects global data center capacity demand to increase from 82.3 GW in 2025 to 219.0 GW by 2030. Against that demand pool, Bloomberg Intelligence estimates that Digital Realty, Equinix, Prologis, Iron Mountain and American Tower together account for only about 20 GW of capacity, including operational assets, projects under construction and future developments. This structural capacity gap supports sustained leasing velocity and pricing power for scaled data center REITs.
We set a 12-month target price for DLR at $223 with a Buy recommendation. A stop loss is advised at the $175 level.
| Ratio Analysis | 2024A | 2025A | 2026E | 2027E | 2028E | 2029E | 2030E | 2031E |
| ROE | 2,8% | 5,7% | 2,1% | 1,9% | 2,0% | 2,0% | 2,1% | 2,1% |
| ROA | 1,3% | 2,7% | 1,0% | 0,9% | 0,9% | 0,9% | 1,0% | 1,0% |
| ROCE | 2,6% | 4,0% | 2,2% | 2,1% | 2,1% | 2,1% | 2,1% | 2,2% |
| Sales/Assets (x) | 0,12x | 0,13x | 0,13x | 0,13x | 0,13x | 0,13x | 0,13x | 0,13x |
| Interest Coverage (x) | 2,35x | 3,97x | 2,11x | 1,98x | 2,00x | 2,02x | 2,03x | 2,04x |
| Margins, % | 2024A | 2025A | 2026E | 2027E | 2028E | 2029E | 2030E | 2031E |
| Gross margin | 55% | 55% | 56% | 56% | 56% | 56% | 56% | 56% |
| EBITDA margin | 51% | 59% | 46% | 45% | 45% | 45% | 45% | 45% |
| Net Income margin | 10% | 21% | 8% | 7% | 7% | 7% | 7% | 7% |
| Financials, $mln | 2024A | 2025A | 2026E | 2027E | 2028E | 2029E | 2030E | 2031E |
| Revenue | 5 555 | 6 113 | 6 836 | 7 650 | 8 584 | 9 558 | 10 454 | 11 225 |
| Cost of sales | -2 519 | -2 727 | -3 011 | -3 402 | -3 818 | -4 251 | -4 649 | -4 992 |
| Gross Income | 3 036 | 3 386 | 3 825 | 4 248 | 4 766 | 5 307 | 5 805 | 6 233 |
| Operating and Other Income/(Loss) | -201 | 247 | -699 | -812 | -898 | -988 | -1 071 | -1 143 |
| EBITDA | 2 835 | 3 632 | 3 126 | 3 436 | 3 868 | 4 319 | 4 733 | 5 090 |
| Depreciation and Amortization | 1 772 | 1 895 | 2 101 | 2 355 | 2 642 | 2 942 | 3 218 | 3 455 |
| EBIT | 1 063 | 1 738 | 1 025 | 1 081 | 1 226 | 1 376 | 1 515 | 1 634 |
| Interest Expenses | -453 | -438 | -487 | -545 | -612 | -681 | -745 | -800 |
| Loss on Early Debt Extinguishment | -6 | 0 | -4 | 0 | 0 | 0 | 0 | 0 |
| EBT | 617 | 1 300 | 542 | 536 | 614 | 696 | 770 | 835 |
| Taxes | -55 | -32 | -29 | -20 | -22 | -25 | -28 | -30 |
| Net Income to Сommon Shares | 562 | 1 268 | 513 | 517 | 592 | 671 | 743 | 805 |
| Diluted EPS | $1,61 | $3,58 | $1,42 | $1,40 | $1,56 | $1,72 | $1,85 | $1,94 |
| DPS | $4,88 | $4,88 | $4,88 | $5,24 | $5,69 | $6,14 | $6,52 | $6,79 |