
Investment Review №349. High Hopes
Market Environment as of July 13
Global Perspective
Over the period, U.S. equities posted positive but uneven performance. The S&P 500 gained 1.01%, while the Dow Jones Industrial Average rose 0.61%. In contrast, the Nasdaq-100 declined 1.72%. The equal-weight S&P 500 added 0.55%, while small- and mid-cap equities underperformed, with the iShares Russell 2000 down 1.84%, the S&P SmallCap 600 off 1.61%, and the S&P MidCap 400 falling 1.66%. The divergence points to continued selectivity in investor positioning. Buying interest at the headline index level remained concentrated in a limited number of large-cap sectors and companies, while small- and mid-cap stocks failed to attract comparable demand. As a result, market participation remained relatively narrow.
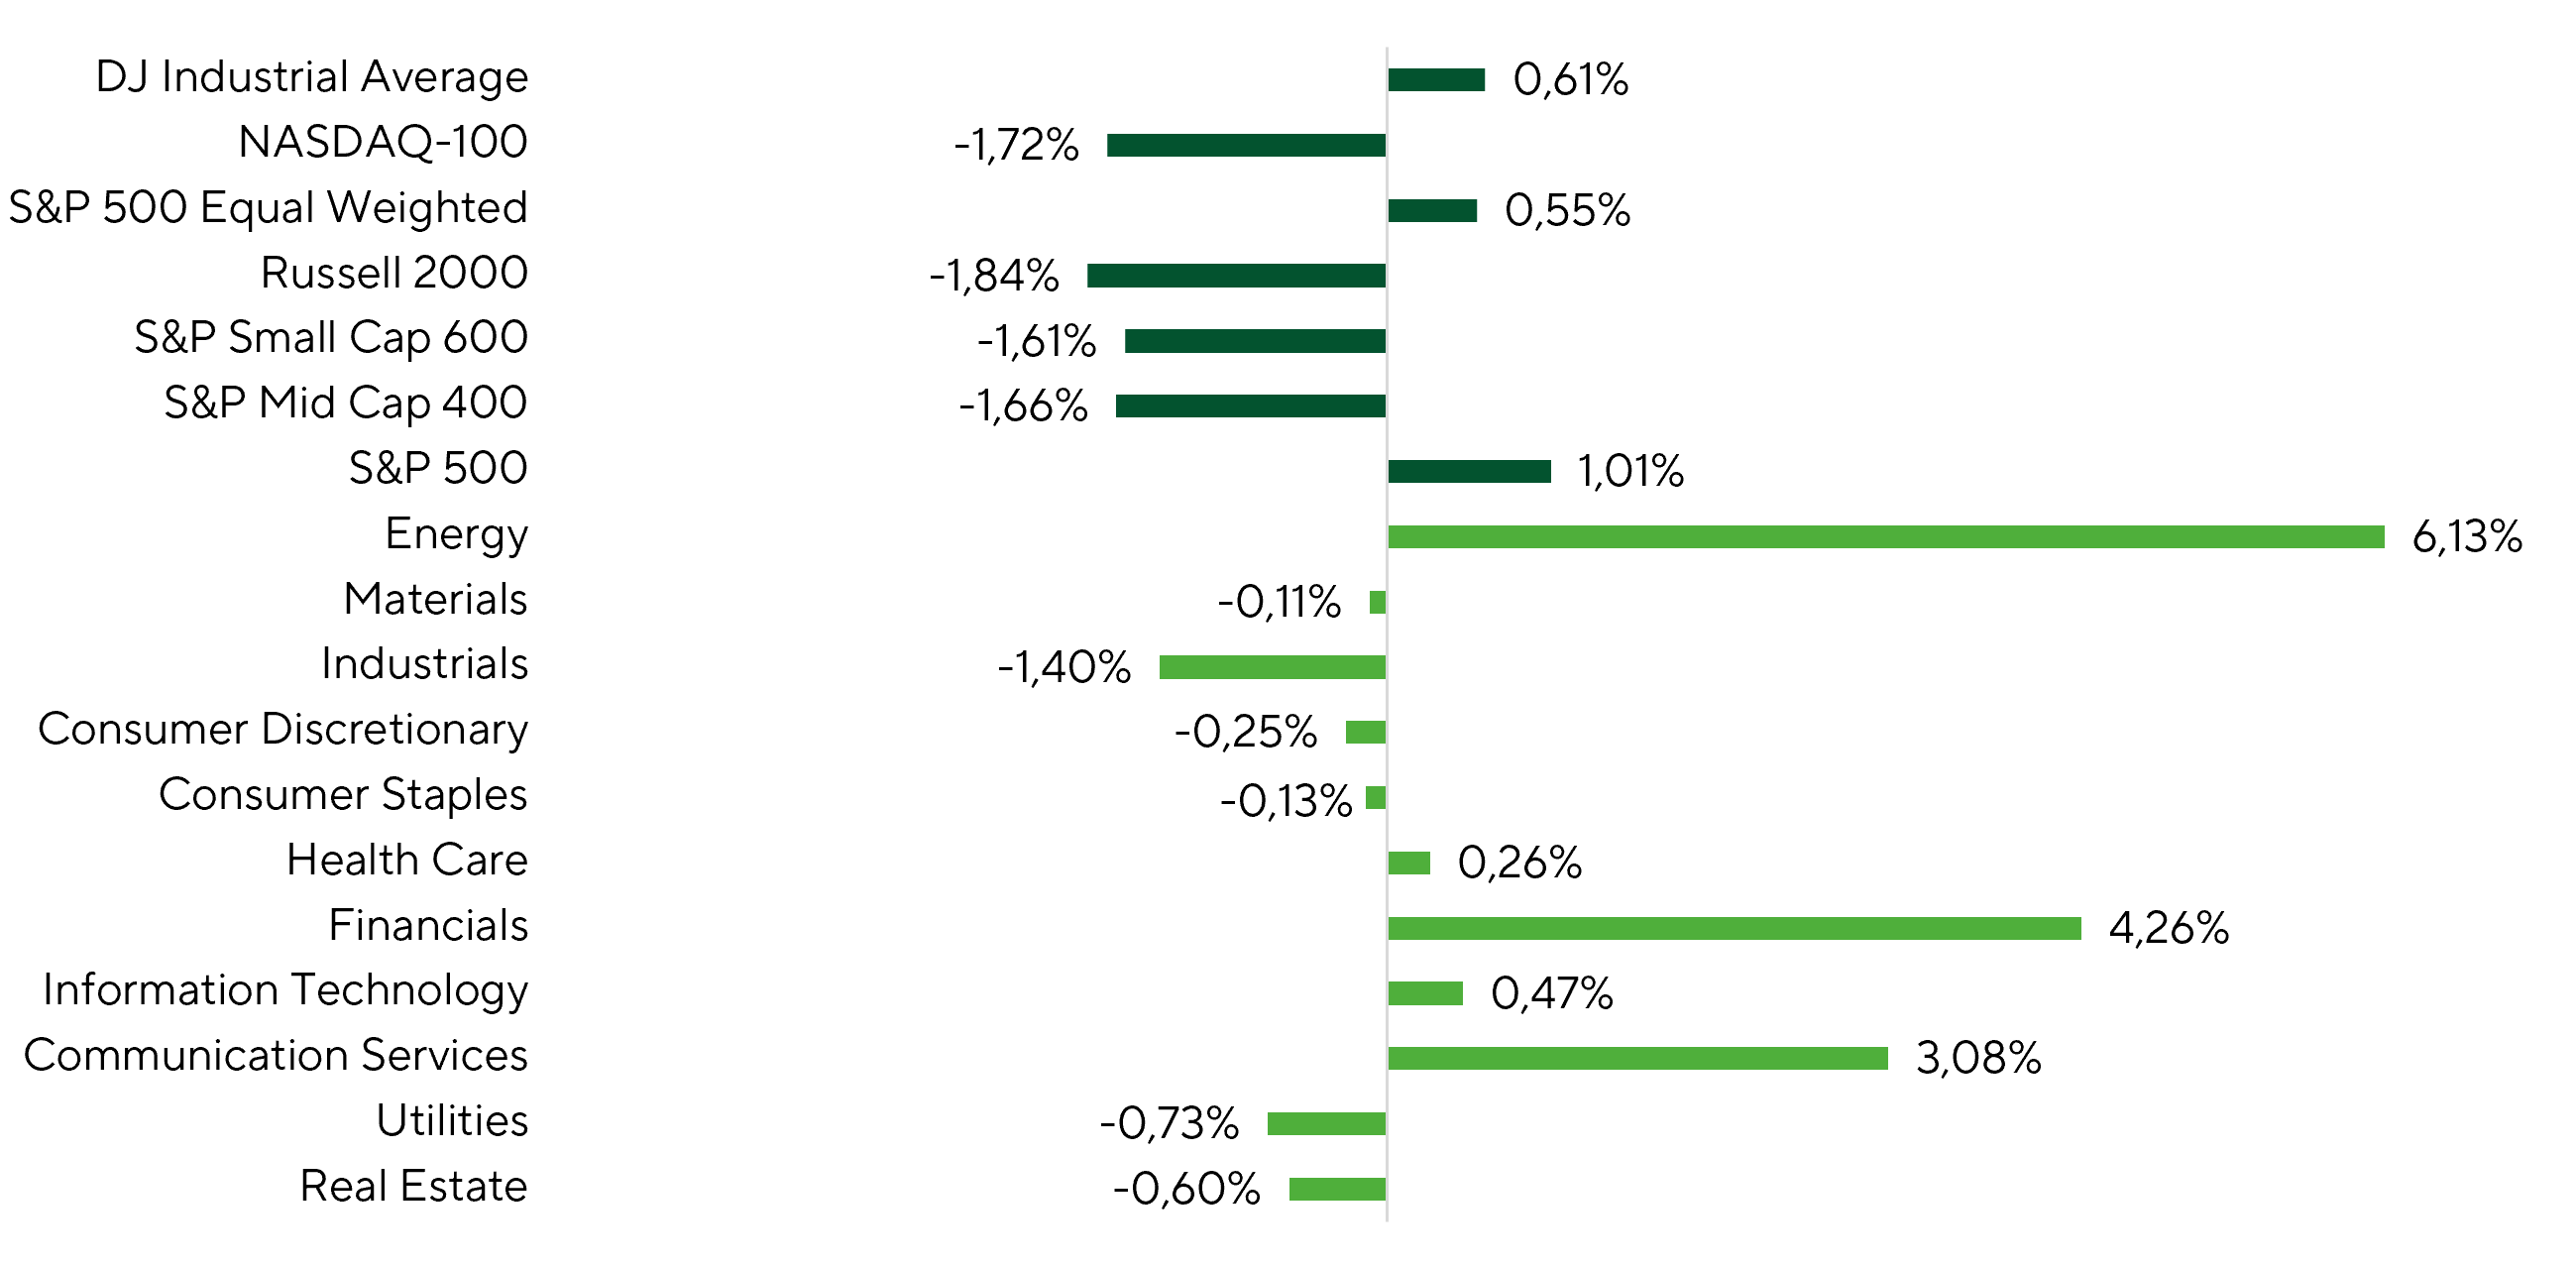
Index and Sector Returns During the Review Period
Source: FactSet, Freedom Broker analysis
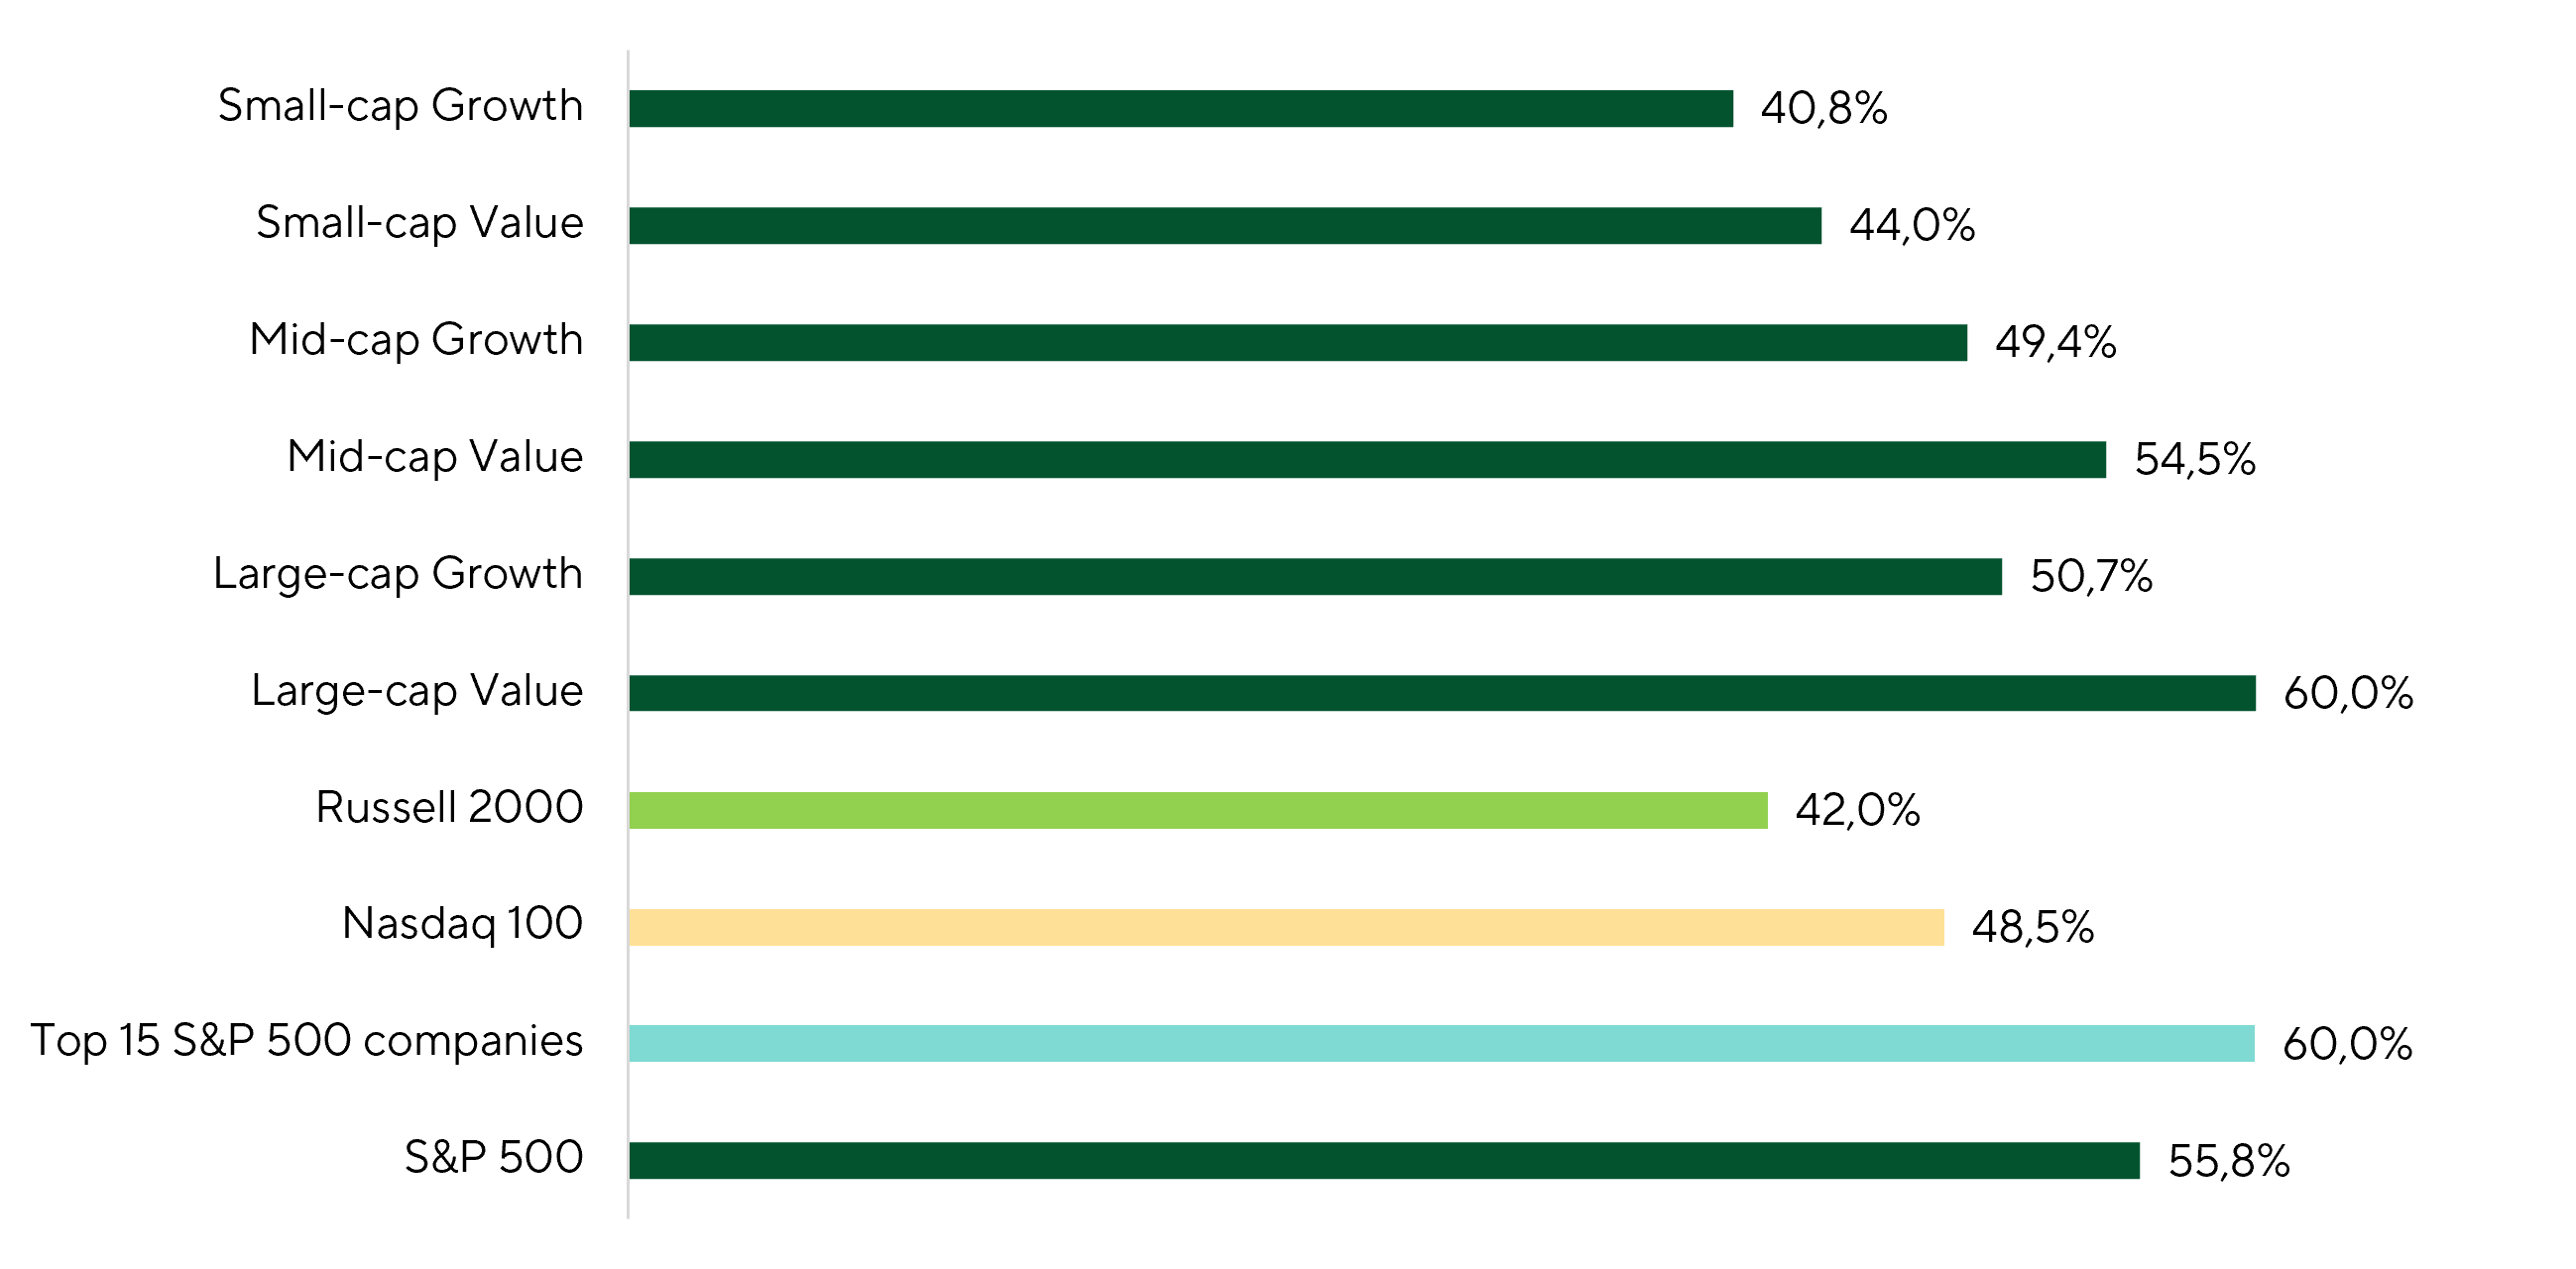
Share of Constituents Posting Positive Returns Across Indexes During the Review Period
Source: FactSet, Freedom Broker analysis
Despite the Nasdaq-100 emerging as the weakest-performing large-cap benchmark over the two-week period, the IT sector saw notable internal rotation. Elevated volatility remained concentrated in AI infrastructure-related names, with semiconductor and memory-chip stocks experiencing the sharpest correction. Over the period, the Roundhill Memory ETF (DRAM) declined 20.3%, while the iShares Semiconductor ETF (SOXX) fell 9.9%. In contrast, shares of the largest hyperscalers and software companies posted solid gains. The Roundhill Magnificent Seven ETF (MAGS) advanced 5.5%, the Global X Cybersecurity ETF (BUG) gained 7.1%, and the iShares Expanded Tech-Software Sector ETF (IGV) rose 3.1%. The divergence underscores the market's continued search for more resilient areas within the sector. On one hand, investors are sizing up the AI infrastructure outlook, assessing the durability of the data center build cycle and how long elevated demand for semiconductors and memory can persist. On the other, attention remains fixed on AI monetization models and business cases, as well as the justification for the aggressive capex buildout among the largest hyperscalers. At the same time, the market continues to assess the potentially disruptive impact of AI innovation on the software sector, specifically which products could be displaced, how quickly the transition may unfold, and which companies are best positioned to adapt to an evolving competitive landscape. As a result, the rotation within the sector reflects not a retreat from the AI theme, but a reassessment of how future economic value will be distributed across infrastructure providers, platforms, and software developers.
Further confirmation of strong investor appetite for AI exposure came from SK Hynix’s Nasdaq ADR debut under the SKHY ticker. The South Korean memory-chip manufacturer raised $26.5bn in the largest-ever U.S. listing by a foreign issuer. The ADRs were priced at $149, with the offering oversubscribed by more than 7x. According to the company, proceeds will be allocated toward expanding production capacity and acquiring equipment required to meet accelerating demand for memory chips. The successful offering highlights global institutional investors’ willingness to pay for direct exposure to the HBM market—the critical memory technology powering high-performance AI accelerators. SK Hynix is a market leader in HBM and one of Nvidia’s key suppliers. The strong Nasdaq debut could also serve as a benchmark for other Asian technology companies considering U.S. capital markets access. Against this backdrop, Samsung is reportedly evaluating a potential U.S. equity offering as well.
Financials led sectoral gains over the period, surging 4.26%, with 90.9% of constituents closing in positive territory, which points to broad-based rather than concentrated recovery. YTD, however, the sector remains one of the notable laggards across economic segments, up just 2.3%. The underperformance reflects a confluence of factors: inflationary pressure eroded the real value of financial institutions' loan books, compression in the 2s10s spread capped NIM expansion potential, and lingering market anxiety around private credit weighed further on investor appetite. That said, the sector has found a floor and begun to recover. Financials are drawing support from a shift in market narrative toward higher-for-longer rates—a configuration that should underpin loan book yields and NIM. Additional tailwinds include solid fundamentals and relatively undemanding forward valuations.
The sector’s fundamental resilience is showing up in results from systemically important U.S. banks. So far in 2Q earnings season, S&P 500 financials are delivering EPS growth of 16.51% YoY, well above the market’s initial 5.15% expectation. The strength is coming mainly from higher investment-banking revenue, supported by stronger activity in IPOs, debt issuance, and corporate lending. Valuation does not look stretched. The sector trades at around 15.7x NTM P/E, close to its three-year median of 15.8x. If earnings momentum holds, share-price gains can be supported by EPS growth, allowing the sector to continue rerating without meaningful multiple overheating.
At the industry level, Energy was the clear outperformer, rising 6.13% as oil prices climbed. The move in crude was driven directly by renewed geopolitical escalation between the U.S. and Iran. The latest flare-up requires a fresh look at upside oil-price scenarios. Freedom Broker analysts note that, if the Middle East conflict escalates further, the risk is that it shifts from a limited exchange of strikes to disruptions affecting key energy infrastructure and transport routes. That scenario could include escalation around the Strait of Hormuz, followed by spillover to the Bab el-Mandeb Strait, as well as Iranian and Houthi strikes on oil and natural gas facilities in Gulf countries, export terminals, tankers, and refining capacity.
Under this setup, we do not rule out a near-term move in WTI toward $130/bbl. If that scenario plays out, it could further boost already elevated expectations for U.S. oil and gas profitability. Consensus currently expects energy-sector EPS to rise 64.6% YoY in 2026, before declining 10.5% in 2027. In other words, the market still treats the earnings surge as temporary—a function of geopolitics that should fade as tensions ease and energy prices normalize. A sustained rise in oil prices would challenge that path. In that scenario, energy would benefit not only from a short-term geopolitical premium, but from a longer energy shock marked by persistently high prices and durable corporate cash flows.
As noted in our previous review, short-term inflation expectations have closely tracked oil prices since the Middle East conflict began. In 2Q, the correlation between the two variables remained high, showing that investors mainly priced the oil shock through the near-term inflation channel. Another oil spike would likely push short-term inflation expectations higher again. For now, the market is pricing limited risk of a meaningful increase, with the 1Y inflation expectation measure holding near 2.0%. Investors should therefore watch this indicator closely as the Middle East conflict evolves. A reversal in inflation expectations could reshape both the Fed rate path and valuations across rate-sensitive sectors.
From a macro perspective, June inflation was the main event. The report came in below consensus and meaningfully softer than prior readings. Headline CPI fell 0.4% MoM in June after rising 0.5% in May, the steepest monthly decline since April 2020. On a YoY basis, inflation slowed to 3.5% from 4.2%. Core CPI was flat on the month and rose 2.6% YoY, down from 2.9% in May. The slowdown was driven mainly by energy, as oil prices fell sharply in June. The energy index dropped 5.7% MoM, fully offsetting increases in shelter and food.
Under the Middle East escalation scenario outlined above, however, energy could again become a source of upward pressure on CPI in the coming releases.
Market Focus
Over the next few weeks, investor attention will focus on Q2 2026 earnings. Financials, as usual, kicked off the season, while over the next week and a half, 245 S&P 500 constituents—nearly half the index—are slated to report.
The market heads into the season with elevated expectations. As of July 13, Bloomberg consensus forecasts aggregate S&P 500 EPS growth of 21.7% YoY for Q2. If realized, that would mark a second consecutive quarter of EPS growth above 20% YoY. Expectations have moved up notably: three months ago, consensus pointed to +18.3% YoY, but by the start of earnings season the estimate had been revised higher by 340 bp.
Expected 2026 EPS growth remains narrowly concentrated. The strongest gains are predicted in Energy—due to elevated Q2 oil prices—and in IT, driven by the ongoing semiconductor and AI infrastructure investment cycle. For other sectors, the current earnings season will test margin resilience amid higher energy costs and persistent geopolitical risks. Typically, S&P 500 companies tend to beat consensus, but in 2026 the magnitude of earnings surprises has increased: Q1 EPS exceeded estimates by an average of 16.3% (the highest in the review period), and Q2 implies a 14.5% beat, roughly double the five-year average of about 7%. Current valuations thus reflect not only robust expected earnings growth but also substantial upside surprise potential. In this context, headline beats may not be enough to support share prices if actual growth, management guidance, or margin commentary fails to validate the optimism already priced in.
Accordingly, this earnings season is a critical test of corporate resilience. Strong prints could fuel near-term upside, while disappointments against elevated expectations could trigger a correction—particularly among the most richly valued sectors and names.
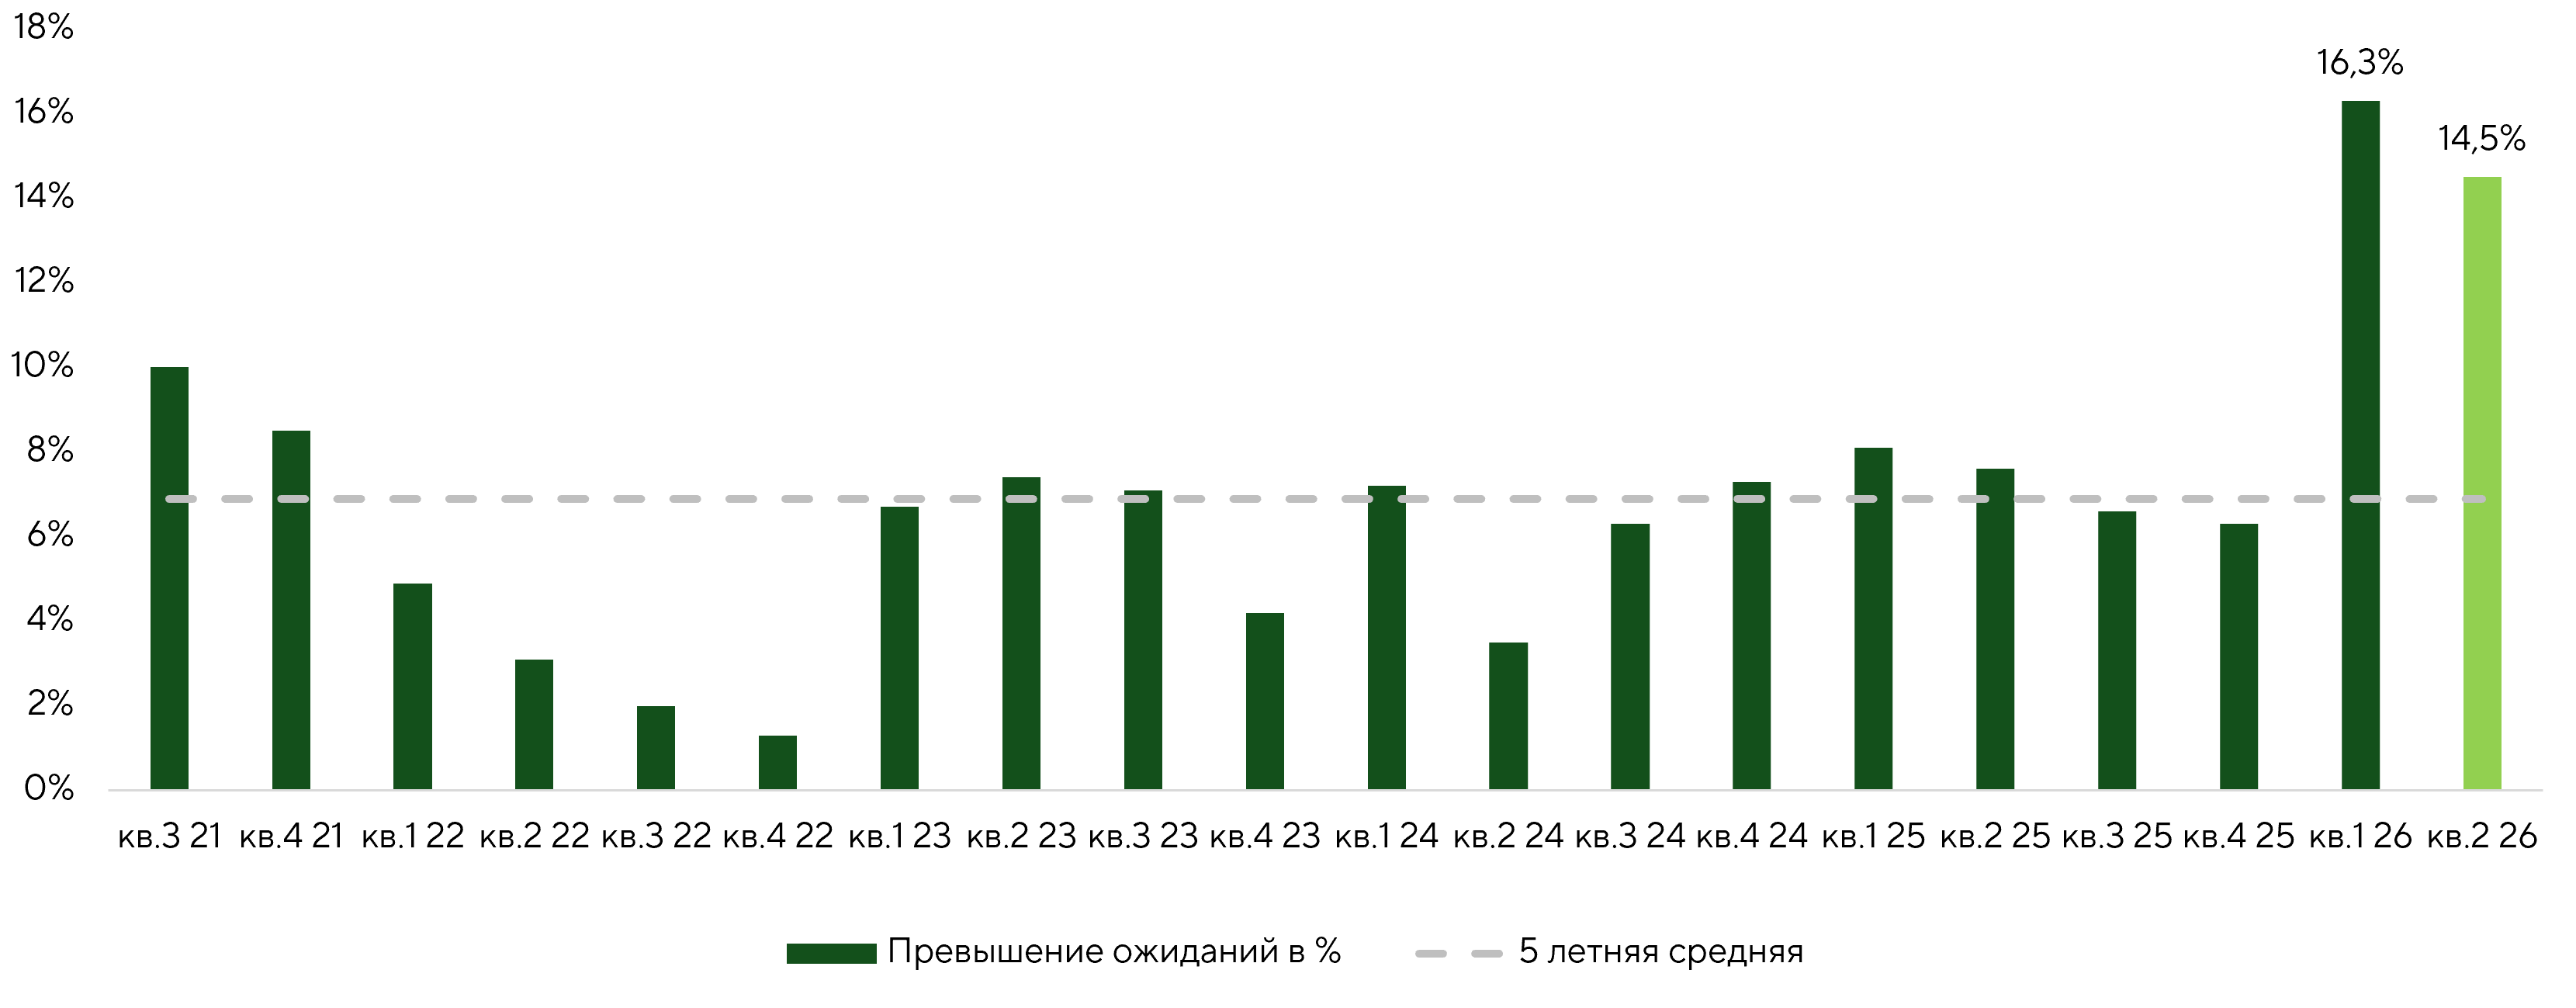
EPS Guidance Excess over S&P 500 EPS Consensus
Source: FactSet, Freedom Broker analysis.
Note: The Q2’26 figures are estimates.
Over the next 10-11 days, analysts highlight several upcoming reports likely to attract elevated investor interest.
Alphabet will report Q2’26 results on July 22, following an exceptionally strong Q1 that combined accelerated growth with improved profitability despite heavy AI infrastructure investment. In the prior quarter, revenue rose 22% YoY to $109.9bn, operating income increased 30% to $39.7bn, net income grew 81% to $62.6bn, though a significant portion of the increase was attributable to non-operating items—primarily revaluation and return on financial assets—rather than core operating performance. Operating margin expanded to 36.1% from 33.9%. Growth continues to be driven by accelerating ad revenue in Search and YouTube and rapid expansion in Google Cloud, whose revenue reached $20.0bn, up 63% YoY, alongside a notable improvement in segment margins. Longer-term support comes from fast-developing AI products, rising paid subscriptions, and sizable capex, which totaled $35.7bn in Q1. Investors will focus on the sustainability of growth in Cloud and advertising, FCF trends, and management’s commentary on AI ROI. The current consensus price target for Alphabet shares is $435.
Lockheed Martin will report for Q2’26 on July 23, following a solid Q1’26 that underscored the strength of its defense portfolio amid sustained demand for high-precision munitions and missile‑defense systems. In the previous quarter, sales were $18.0bn; segment operating income amounted to $1.8bn, with a 10.1% margin and EPS of $6.44. FCF was negative ($291m), reflecting elevated capex (~$511m) and R&D spending of $458m. Key drivers remain the ramp-up in missile programs and higher volumes in Missiles and Fire Control. This segment’s sales grew 8% to $3.6bn in Q1’26 on accelerated deliveries. Ongoing production capacity expansion and long‑term Department of Defense contracts support the medium‑term outlook. For 2026, management guides to sales of $77.5–$80.0bn and FCF of $6.5–$6.8bn. Into the print, investors will focus on margin trajectories for key programs, execution against production plans, and management’s commentary on U.S. budget policy and backlog durability. The consensus price target for Lockheed Martin is $611 per share.
Broad Market Technical Analysis
The S&P 500 retains an upward bias and has again moved toward the upper end of its consolidation range near 7,620. The index remains firmly above its 20- and 50-day moving averages, while the RSI has risen to 59, signaling positive momentum without overbought conditions.
At the same time, breadth has stopped improving. The share of stocks trading above their 50-day moving averages remains around 62–63%, so the move still lacks broader confirmation. The short-term setup remains moderately positive. A sustained break above 7,620 would open the door to the next target near 7,700. The nearest support is in the 7,420–7,475 area, where a local level and short-term moving averages converge. A stronger demand zone remains at 7,240–7,300. As long as the index holds above 7,420, the base case remains a retest of 7,620, followed by a potential push toward fresh highs.
Expected Trading Range
We expect the S&P 500 to trade in a 7,420–7,700 range.