Investment Review №327. The soft power of the Federal Reserve

Vadim Merkulov
Head of Analytics department
Orla Mining. The golden mean
Orla shares are attractive for purchase with a target price of $14
About Company
Orla (ORLA) is building a multi-asset, Americas-focused gold platform with three clear growth levers: the recently acquired, long-life Musselwhite underground mine in Ontario; the low-cost Camino Rojo Oxide cash engine in Mexico with a sizable underground/sulphide expansion path; and the South Railroad heap-leach project in Nevada that just restarted federal permitting with a Notice of Intent to prepare an EIS. The Musselwhite deal (closed Feb 28, 2025) more than doubled Orla’s production base and diversifies jurisdictional risk. Together, these catalysts underpin a visible, multi-year growth runway.
| Ticker | ORLA |
| Share price as of analysis | $10,4 |
| Target share price | $14 |
| Growth potential | 34,62% |
| Stock vs Indices | Day | Week | Month | Quarter | Year |
| ORLA | (0,3%) | 3,3% | (0,4%) | (0,4%) | 139,6% |
| S&P 500 | (0,4%) | (0,2%) | 0,8% | 11,0% | 14,3% |
| Russell 2000 | (1,0%) | 1,9% | 3,5% | 14,7% | 5,4% |
| DJ Industrial Average | (0,8%) | 0,8% | 0,8% | 8,8% | 10,0% |
| NASDAQ Composite Index | (0,2%) | (0,8%) | 1,6% | 14,5% | 20,0% |
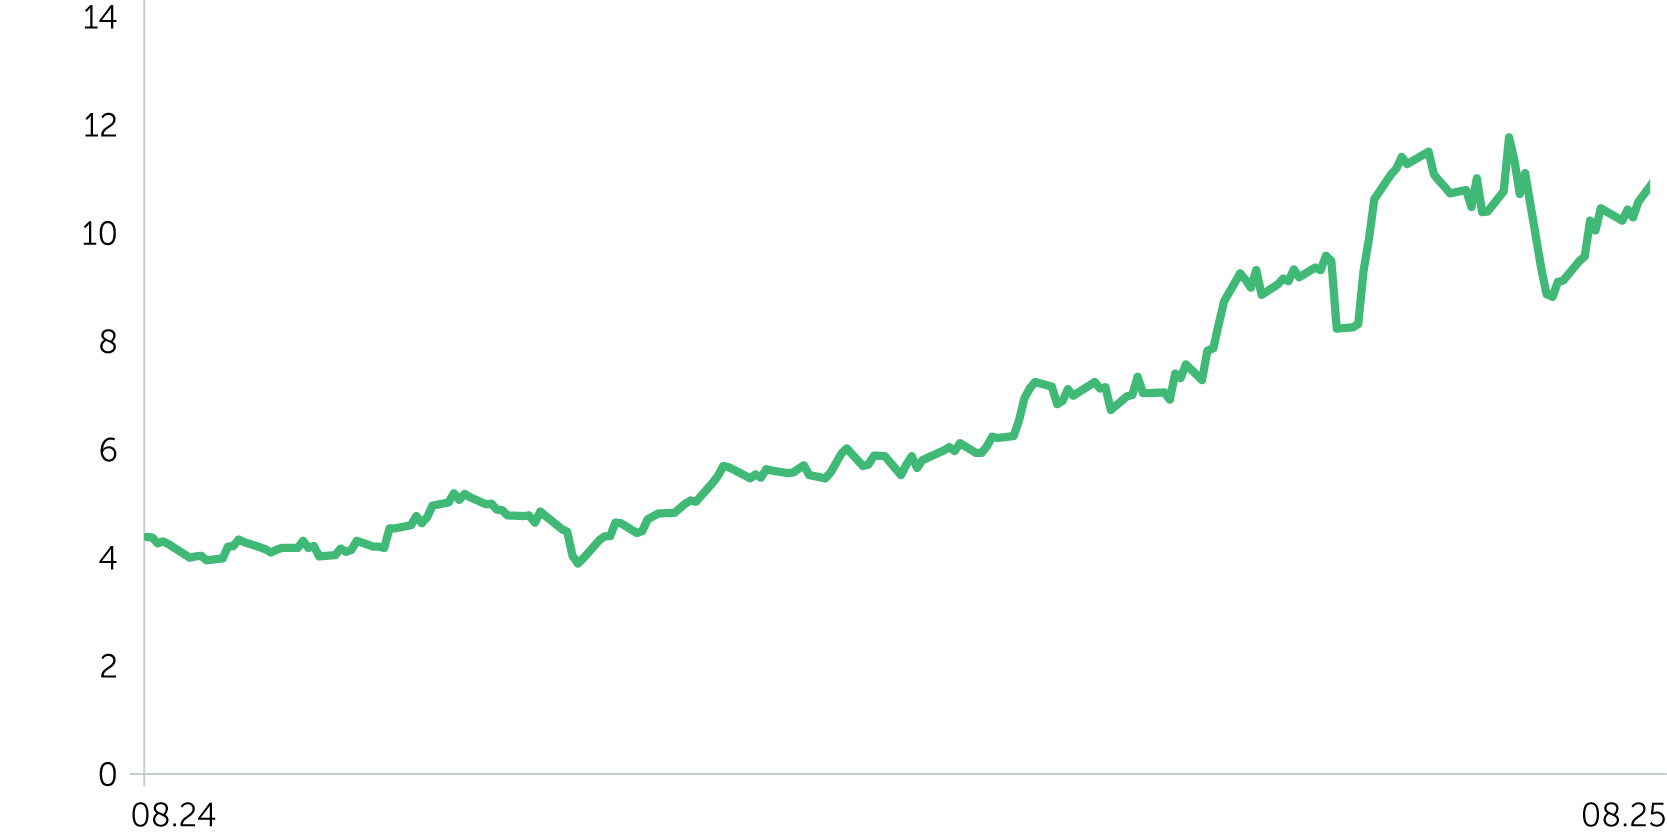
Price dynamics ORLA, $
Investment Thesis
- We think the market overreacted to July’s pit-wall event at Camino Rojo and the subsequent guidance trim. Orla detailed a remediation plan (50–80 m pushback, resequencing) and updated FY-2025 outlook, emphasizing continuity of processing and near-term restoration of full in-pit access. Importantly, the issue did not alter the broader growth case (Musselwhite integration, South Railroad permitting, Camino Rojo UG studies). In our view, the share-price drawdown prices in a structural impairment that is inconsistent with the company’s own plan and the modest, quantified impact reflected in revised guidance. That sets up a sentiment re-rate as operational risks reduce over H2-2025.
- Orla remains positioned in the lower-cost cohort. Camino Rojo has been a standout low-unit-cost operation since start-up; in Q1-2025 Orla reported $597/oz cash costs at Camino Rojo and $845/oz consolidated AISC (pre-incident). Even after incorporating the pit-wall response and Musselwhite onboarding, Camino Rojo’s 2025 site AISC guidance of $875–$975/oz compares favorably to many peers. As mining sequences normalize, we expect consolidated unit costs to drift back toward Orla’s historical profile, restoring margin resilience versus the curve.
- The gold price is a tailwind. Gold has been one of 2025’s best-performing macro assets, supported by expectations of Fed easing, persistent geopolitical risk, and robust central-bank buying. Mid-year outlooks from the World Gold Council and sell-side strategists point to prices consolidating at elevated levels (~$3,600–$3,700/oz near-term base cases) with upside skew into 2026; ETF flows have turned positive, and several houses (e.g., UBS) have raised targets. Elevated spot with supportive flows amplifies operating leverage for low-AISC producers like Orla and improves project NPV/IRR for South Railroad and Camino Rojo underground.
We set a target price for O at $63 with a “Buy” recommendation. A stop-loss is advised at the $52.8 level.
| Marginality % | 2022A | 2023A | 2024A | 2025E | 2026E | 2027E | 2028E | 2029E | 2030E |
| Gross margin | 64% | 58% | 65% | 64% | 66% | 69% | 67% | 67% | 67% |
| EBITDA margin | 57% | 51% | 59% | 60% | 64% | 67% | 66% | 66% | 66% |
| Net Income margin | 24% | -12% | 26% | 31% | 37% | 40% | 37% | 36% | 37% |
| Ratio Analysis | 2024A | 2025E | 2026E | 2027E | 2028E | 2029E | 2030E |
| ROE | 22% | 71% | 85% | 78% | 49% | 32% | 26% |
| ROA | 14% | 48% | 72% | 30% | 28% | 22% | 21% |
| ROCE | 17% | 61% | 75% | 68% | 44% | 27% | 24% |
| Sales/Assets (x) | 0,56x | 1,54x | 1,91x | 0,76x | 0,74x | 0,61x | 0,57x |
| Interest Coverage (x) | 31,61x | 16,17x | 29,02x | 31,71x | 60,64x | 77,48x | 99,18x |
| Financial performance, $ mn | 2022A | 2023A | 2024A | 2025E | 2026E | 2027E | 2028E | 2029E | 2030E |
| Revenue | 193 | 234 | 344 | 916 | 1 128 | 1 090 | 1 287 | 1 170 | 1 200 |
| Cost of sales | 69 | 98 | 120 | 334 | 379 | 341 | 419 | 381 | 391 |
| Gross Income | 124 | 136 | 224 | 582 | 749 | 749 | 868 | 789 | 809 |
| SG&A | 13 | 17 | 22 | 32 | 24 | 19 | 19 | 15 | 16 |
| EBITDA | 111 | 119 | 202 | 550 | 725 | 729 | 849 | 775 | 793 |
| Depreciation and Amortization | 16 | 30 | 42 | 122 | 146 | 125 | 199 | 195 | 186 |
| EBIT | 95 | 89 | 160 | 428 | 580 | 605 | 650 | 580 | 607 |
| Interest Expenses | 8 | 11 | 6 | 34 | 25 | 23 | 14 | 10 | 8 |
| EBT | 78 | 8 | 176 | 394 | 555 | 582 | 636 | 570 | 599 |
| Taxes | 33 | 35 | 87 | 109 | 132 | 142 | 156 | 143 | 151 |
| Net Income | 46 | -27 | 89 | 285 | 423 | 439 | 480 | 427 | 449 |
| Diluted EPS | $0,21 | $0,15 | $0,25 | $0,67 | $1,00 | $0,94 | $1,47 | $1,89 | $1,99 |
| DPS | $- | $- | $- | $- | $- | $- | $- | $- | $- |