Investment Review №337. A shift toward hedging
Review as of January 26
Global Perspective
Over the past two weeks, the U.S. equity rally has broadened, though overall momentum has slowed. Major benchmarks softened: the Dow Jones Industrial Average and S&P 500 each declined 0.4 percentage points, while the tech-heavy Nasdaq 100 slipped 0.3 points. At the same time, gains continued outside the megacap segment, with the equal-weighted S&P 500 rising 0.7% and small-cap stocks advancing, as the Russell 2000 and S&P SmallCap 600 increased 0.9% and 1.3%, respectively.
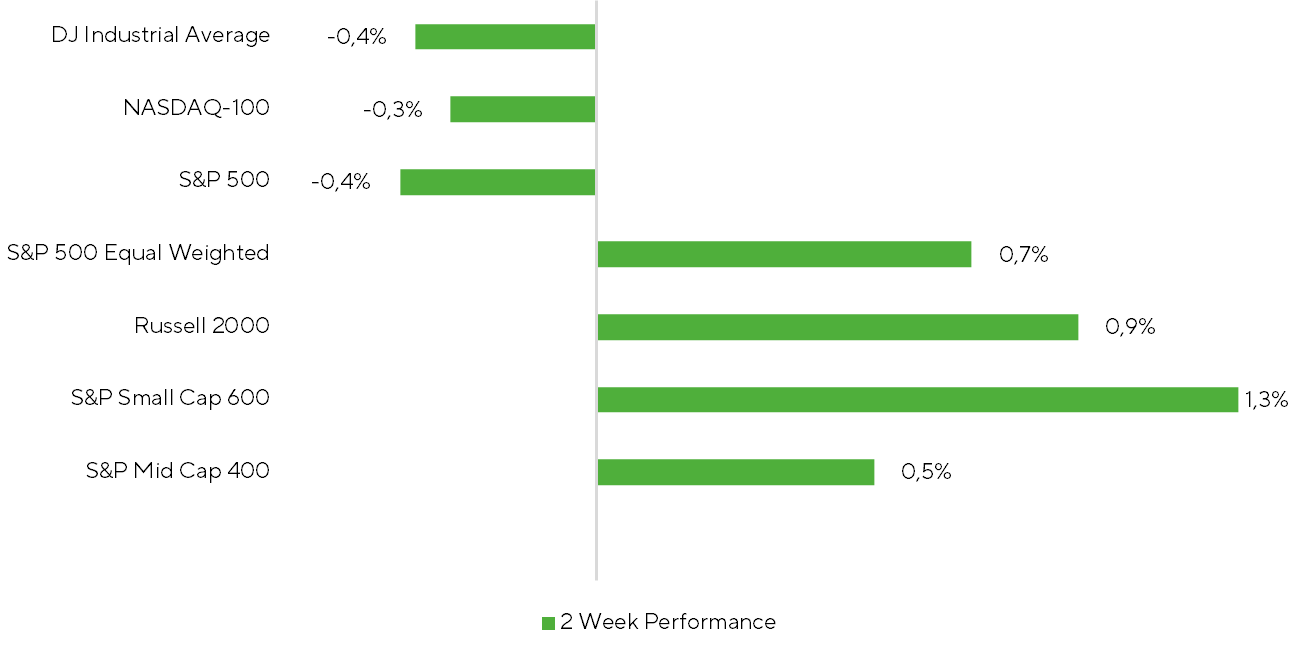
Returns of broad market indices over a two-week period
Source: FactSet, Freedom Broker Analysis
Despite ongoing rotation into equities beyond the megacap segment, market breadth showed early signs of contraction. Over the review period, only 56.5% of S&P 500 constituents and 55.6% of Russell 2000 members delivered positive returns. This suggests the advance is being driven by a narrowing group of names, implying that the current uptrend may be poised for a pause or consolidation after a strong start to 2026.
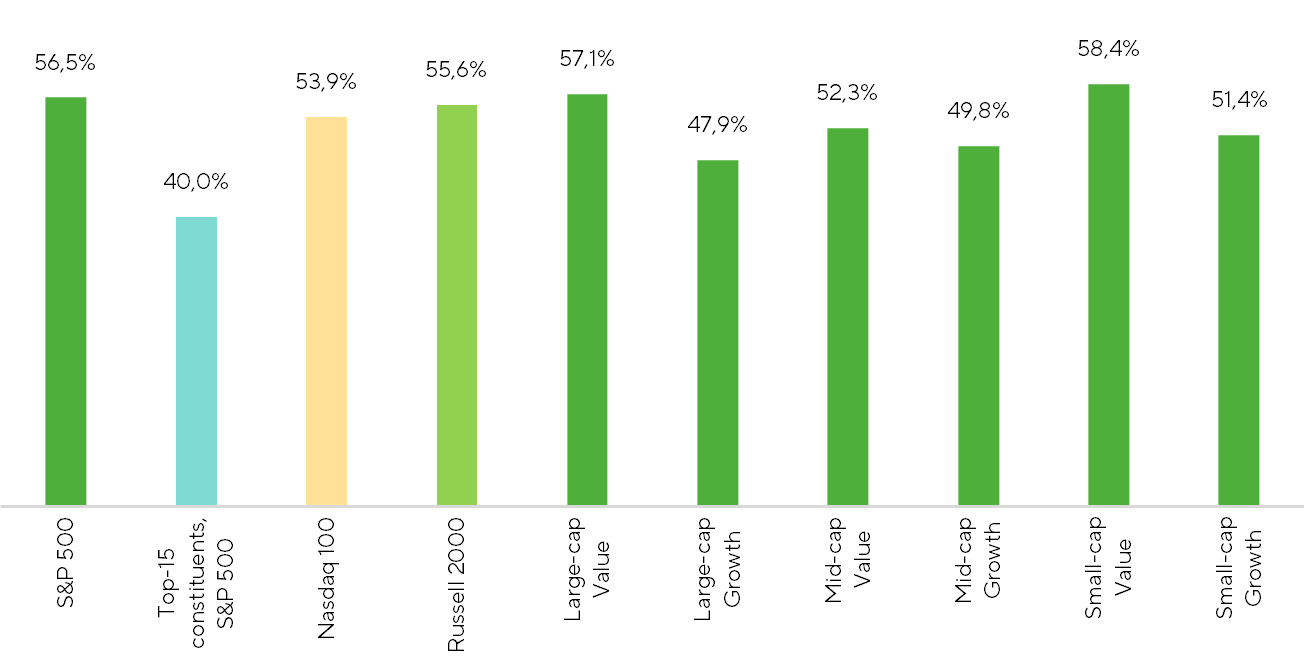
Market Breadth: % of companies w/ positive return
Source: FactSet, Freedom Broker Analysis
From a sectoral standpoint, energy led the charge, surging 6.3%, with XLE breadth hitting 91.7%. The market appears to be actively pricing in the so-called Iranian factor, which is amplifying near-term oil price uncertainty. A potential U.S. military operation could trigger a sharp, short-term spike in crude, as any disruption to the Strait of Hormuz—a chokepoint for roughly 15–20% of global crude, NGL, and refined product shipments—would pose immediate supply risks.
At the same time, U.S. energy equities appear to be trading at elevated levels relative to underlying oil market fundamentals, which remain defined by soft prices and surplus supply. Freedom Broker analysts continue to anticipate weak operating results from upstream producers, as average WTI prices fell 9% QoQ in Q4 2025. Oilfield services firms may also report softer quarterly and annual performance, while refiners are likely to face margin compression amid declining U.S. gasoline prices. We see the upcoming earnings season as a potential headwind for the sector after the sharp rally over recent months.
Precious metals remain a focal point for investors, with spot gold and silver reaching record highs, surpassing the psychologically significant thresholds of $5,000 and $100 per troy ounce, respectively. Mining equities have mirrored the rally in underlying metals amid expectations of stronger free cash flow generation. Over the review period, ETFs tracking gold and silver miners—GDX and SIL—advanced 12.3% and 19.2%, respectively.
Support for precious metals remains anchored in familiar drivers: escalating geopolitical tensions, a softer U.S. dollar, ongoing central bank accumulation, and sustained demand from private investors.
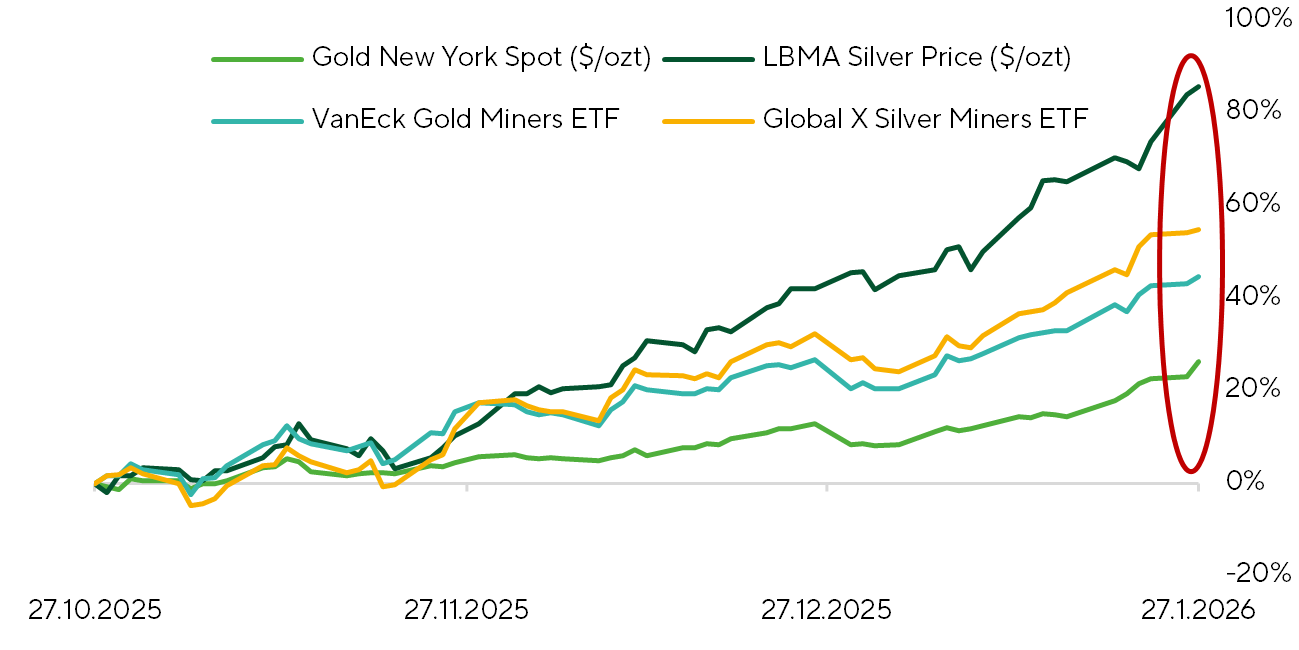
Normalized returns of precious metals and their miners
Source: FactSet, Freedom Broker Analysis
Investor attention is extending beyond precious metals. Data from Goldman Sachs and EPFT show that inflows into commodity-focused funds have reached their highest levels in a decade since the start of the year. This surge is being driven not only by traditional safe-haven considerations but also by structural shifts in the global economy, including the ongoing clean energy transition, rising demand for industrial metals to support new technologies such as AI infrastructure, and broader electrification trends.
Markets also took note of remarks by U.S. President Donald Trump at the World Economic Forum in Davos, held January 19–23. In a controversial speech, he outlined his administration’s push to reinforce American leadership and national sovereignty, highlighted recent economic achievements, and called on allies to assume a greater share of security responsibilities. On the sensitive issue of Greenland, he emphasized its strategic importance for U.S. national security and floated negotiations for its transfer under American control—while ruling out force but warning of potential consequences if refused. Investors interpreted these comments as indicative of rising geopolitical fragmentation, providing further support for commodity markets.
On the macroeconomic front, two key releases marked the reporting period. December inflation data showed the headline CPI rising 0.3% MoM, in line with consensus, while the core CPI increased 0.239% MoM, coming in below expectations. For full-year 2025, the headline CPI advanced 2.7% YoY and the core CPI rose 2.6% YoY, confirming the ongoing disinflationary trend.
Household income and expenditure data for October–November brought no major surprises on the spending side but pointed to a slowdown in income growth. Consumer outlays rose 0.47% MoM in October and 0.51% MoM in November, while income growth was limited to 0.12% MoM and 0.30% MoM, noticeably below last year’s averages. Between May and November 2025, average income growth stood at just 0.19% MoM, compared with 0.45% MoM for expenditures. While this trend warrants attention, we believe that, assuming stable macroeconomic conditions, income growth could rebound in the months ahead.
On the corporate front, investor focus remains squarely on the Q4 2025 earnings season. So far, roughly 18% of S&P 500 constituents have reported, posting aggregate EPS growth of 9.5% YoY. Information Technology, Industrials, and Communication Services are outperforming, while Energy, Health Care, and Consumer Discretionary lag the broader index. Small-cap equities are also showing notable resilience. More than 12% of S&P SmallCap 600 firms have reported delivering a robust 14.4% YoY lift in aggregate EPS. Nevertheless, with a limited portion of results in, it remains too early to draw definitive conclusions about the trajectory of the earnings season.
Market Focus
Over the next 7-10 days, key focus will be on catalysts likely to set the tone for trading. Chief among them is the risk of another U.S. government shutdown in late January to early February. According to surveys on the Polymarket prediction platform, the probability of a shutdown is 76%.
The risk stems from Congress’s failure to pass full-year appropriations before the current continuing resolution expires on January 30-31. While most of the budget has already been approved, six annual bills remain outstanding, including funding for the Department of Homeland Security (DHS). That is the primary sticking point: Senate Democrats have refused to back a package that includes DHS without reforms to oversight of ICE following a series of controversies, or alternatively they want DHS funding handled in a standalone bill. Republicans are unwilling to make those concessions. As a result, the Senate may not be able to vote on a package before the deadline, automatically triggering a lapse in funding for some federal agencies, and, consequently, a government shutdown.
Should a shutdown occur, Polymarket assigns a 54% probability it lasts seven days or longer. Based on recent experience, a protracted shutdown could disrupt the release of key macroeconomic data and weigh on near-term U.S. GDP growth.
Geopolitics remain a key market driver, particularly developments surrounding Iran and Greenland. Markets are increasingly pricing the risk of a U.S. military operation in Iran: current estimates imply a 31% probability of a direct conflict by mid-February, 56% by end-March, and 64% by end-June. In other words, the market narrative is shifting from “if” to “when.” Any military activity in the region would likely lift oil prices and increase volatility across commodity markets.
Greenland also remains in focus. At the World Economic Forum in Davos, Donald Trump said he had reached a “framework agreement” on Greenland after talks with Mark Rutte, under which the U.S. would allegedly gain full and permanent access to the island. However, no details have been disclosed. A Polymarket survey on the U.S. “buying” part of Greenland implies a 23% probability, but the lack of specifics makes any definitive conclusions premature.
Additional attention is on a potential Fed Chair nomination from the Trump administration, which could be announced in the coming days. According to current Polymarket pricing, the leading candidates are Rick Rieder (46%) and Kevin Warsh (28%). Markets appear to favor Rieder, who is perceived as more open to cutting the Fed rate—a stance aligned with Trump’s preferences. Warsh, by contrast, is seen as more orthodox and less inclined toward aggressive easing or balance sheet expansion. In our view, a Rieder nomination would likely provide near-term support to equities.
On the corporate front, investors will focus on the ongoing earnings season. Over the next two weeks, 195 S&P 500 constituents and 130 S&P SmallCap 600 issuers are scheduled to report. Among the most closely watched releases, we highlight Qualcomm (Feb 4) and Amazon (Feb 5).
QCOM: we remain cautiously constructive but see notable risks into 2026. Near-term results should be solid, supported by an inventory build in smartphones ahead of anticipated 2026 price increases in memory and handsets. While this has temporarily bolstered demand for Qualcomm’s solutions, we also expect it to set up weaker guidance for Q1 2026 and more cautious full-year commentary. The magnitude is difficult to quantify but given that Qualcomm’s smartphone exposure is concentrated in emerging markets, higher memory costs could materially dampen demand. The company has been pushing deeper into the non-premium segment, yet that strategy is under pressure as device costs rise and demand remains price sensitive. The automotive segment looks steadier—channel checks suggest healthy momentum—but it is unlikely to offset a potential slowdown in smartphones. On the positive side, Qualcomm continues to emphasize progress in AI chips; strong guidance here could prompt a favorable market reaction, though we remain skeptical that AI will be a durable growth driver at this stage. Twelve-month price target: $165.
AMZN: the upcoming report looks broadly constructive, with the main overhang being ongoing Project Kuiper launch issues. This remains a background risk that does not materially affect current financials but is important for long-term optionality. In cloud, the outlook is improving: Amazon plans to bring online significant new compute capacity over the coming quarters, which should accelerate AWS growth and relieve prior supply-side constraints. E-commerce trends also appear healthy based on performance around key shopping events, with steady demand and solid operating metrics. Recent workforce reductions add a cost tailwind and may support stronger earnings guidance. The principal swing factor is advertising: despite its high margins and importance to the investment case, near-term trajectory is unclear. Early-season industry checks point to softer Amazon Ads growth versus recent quarters, though such signals have often failed to materialize in reported results. Overall, AMZN remains a top idea for 2026, albeit with typical quarter-to-quarter risks. Twelve-month price target: $300.
Technical Broad Market Analysis
In the second half of January, the S&P 500 briefly undercut its 50-day moving average as a bearish rising wedge appeared to resolve lower. The breakdown quickly failed: buyers stepped in near 6,800, and the ensuing impulsive rebound drove the index to a new all-time high. Market breadth remains constructive, with roughly 65% of constituents trading above their 200-day moving average—near the highs of the past year. The RSI is not signaling overbought conditions, leaving room for further upside. Moving averages continue to trend higher, keeping the technical backdrop tilted in favor of the bulls. Key support is now layered at 6,900 and 6,800.
Expected Trading Range
We anticipate the S&P 500 to trade between 6,800-7,150.