Investment Review №342. A Delicate Balance
Review as of April 6
Global Perspective
Over the past two weeks, U.S. equities have staged a partial rebound following the sharp late-March correction. Major indices closed the period modestly higher: the S&P 500 rose 0.5%, the Dow Jones Industrial Average gained 1.0%, while higher-beta segments led the move, with the S&P SmallCap 600 and S&P MidCap 400 up 2.6% and 2.0%, respectively. The key laggard was the tech-heavy Nasdaq-100, which traded sideways and posted a flat return (+0.01%).
Breadth improved meaningfully, with 65.7% of S&P 500 constituents advancing and a median gain of 1.4%, pointing to a broad but not decisive recovery. That said, the factor tilt matters: investors rotated into value over growth, signaling ongoing skepticism around the durability and quality of the bounce.
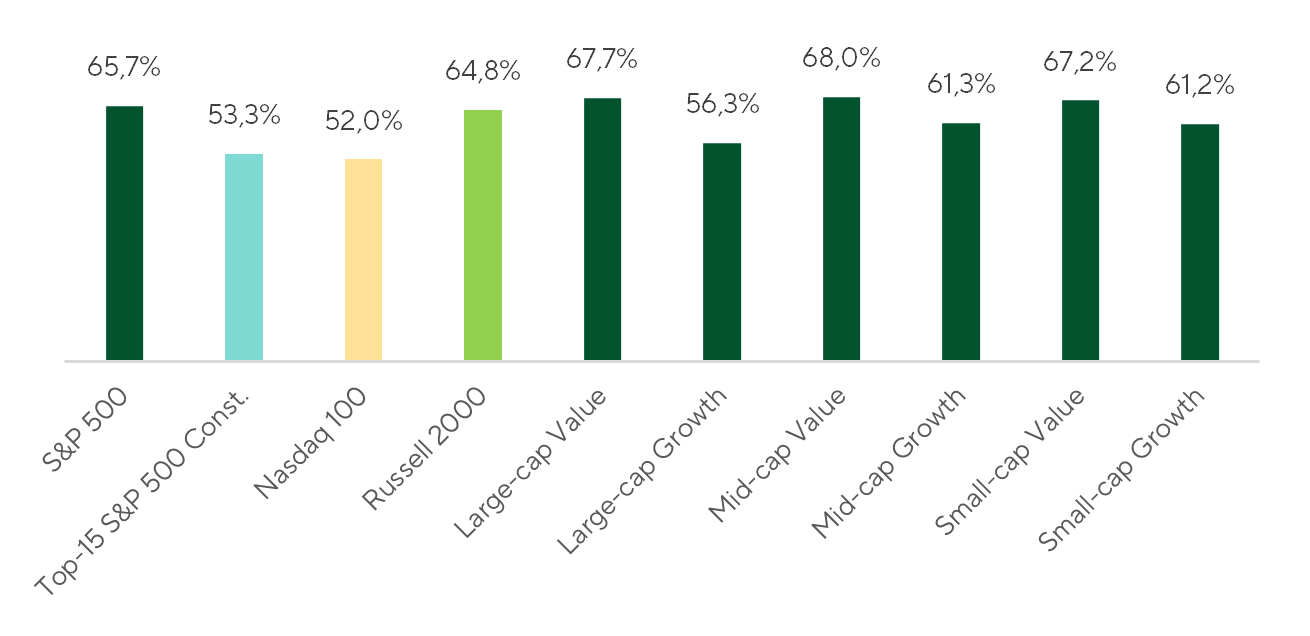
Share of Companies with Positive Returns in the Index over the Period
Source: FactSet, Freedom Broker analysis
Near-term support for equities was driven by expectations of de-escalation in the Middle East. Late-March comments from Donald Trump on “constructive” talks with Tehran, alongside a temporary pause in strikes on Iran’s energy infrastructure, prompted a partial unwind of the geopolitical risk premium in oil. That said, the negotiation backdrop remains fragile and headline-sensitive. In our view, the recent move reflects tactical relief and near-term repricing, rather than a durable shift in fundamentals or a resolution of core geopolitical risks.
Sector leadership reinforces this interpretation. Performance was concentrated in segments exposed to both de-escalation and easing policy expectations. The materials sector led gains (+5.8%), as markets began to discount a gradual normalization of supply chains, supporting a recovery in operating activity. Rate-sensitive sectors also outperformed, with Utilities (+3.1%) and Real Estate (+2.6%) benefiting from a softer rates backdrop. At the front end, the 1-year OIS — reflecting market expectations for the Fed policy rate over a one-year horizon — declined from 3.87% to 3.70% over the past two weeks. This points to a shift away from a tightening scenario toward a more neutral trajectory, implying a stable rate environment over the next 12 months.
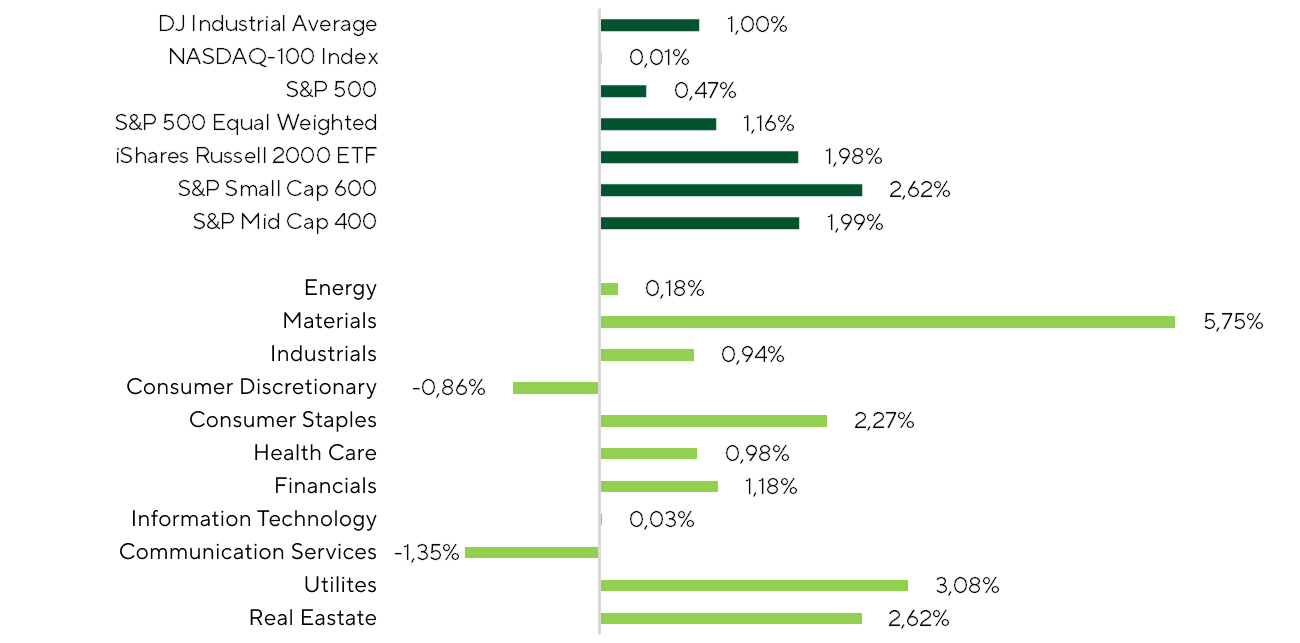
Index and Sector Returns over the Two Periods
Source: FactSet, Freedom Broker analysis
At the same time, energy equities have underwhelmed relative to prior episodes, with the Energy Select Sector SPDR Fund up just 0.2% over the past two weeks. The March rally appears to have been driven less by a shift in long-term fundamentals and more by a pull-forward in expectations. As oil prices spiked, the market repriced near-term earnings materially higher, effectively bringing forward a portion of future growth. In parallel, longer-dated expectations have started to soften, reflecting the view that the current price shock is transitory rather than regime-defining.
The takeaway is that the move is being interpreted as tactical rather than structural. This leaves limited room for further upside, with the trajectory increasingly dependent on whether elevated oil prices can be sustained, or whether expectations continue to be front-loaded into the near term. Absent that, the impact of the current repricing is likely to fade over time.
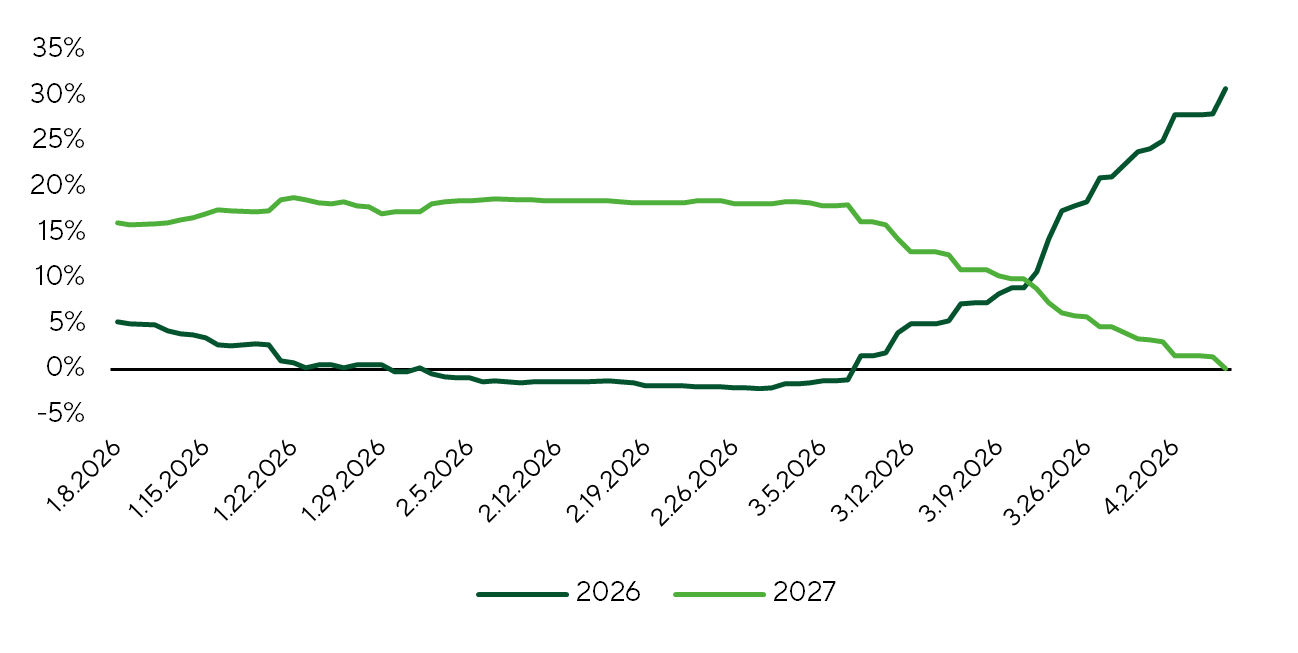
EPS Expectations for the S&P 500 Energy Sector
Source: FactSet, Freedom Broker analysis
Taken together, the current backdrop points to a market still operating in a regime of elevated sensitivity to external drivers. The recent rebound has improved near-term sentiment, but falls short of supporting a durable shift toward a constructive medium-term view.
The bounce should therefore be treated with caution. Markets continue to function in an environment of elevated cross-asset volatility — where price swings are not confined to a single segment but occur simultaneously across equities, rates, commodities, and FX. In this regime, moves in one market are rapidly transmitted across others via shifts in rate, inflation, and liquidity expectations, creating a feedback loop. Correlations become unstable, and the system grows increasingly sensitive to external shocks, such that even localized events can trigger outsized global reactions.
Over the past two weeks, volatility has compressed across select segments, but the move appears technical rather than structural. To a large extent, it reflects the mechanics of the recent rebound: as prices recover, demand for hedging temporarily declines, driving implied volatility lower. In other words, the pullback in volatility is a function of improved sentiment, not evidence of durable stabilization.
The most pronounced compression has been observed in equities and rates. The CBOE Volatility Index declined 7.6%, while the ICE BofA MOVE Index fell 16.8% over the same period. A similar pattern is visible across other assets: the CBOE Gold Volatility Index declined 14.6%, while implied volatility in EUR/USD fell 9.9%.
In contrast, oil continues to price elevated uncertainty, with volatility rising 7.1%, reflecting persistent geopolitical risks and the uncertain trajectory of negotiations between Washington and Iran. Overall, the stabilization process remains fragmented and uneven. We are not seeing a broad-based compression in volatility that would typically signal a transition to a more stable regime. Instead, the market is experiencing a localized calm, while the broader system remains highly reactive and vulnerable to shocks.
| Index | Current value | Change over 14 days, % | Change over 1 month, % |
| Stock market | |||
| S&P 500 (VIX) | 24.16 | -7.6% | -18.1% |
| EM Shares (VXEEM) | 34.61 | +3.7% | -6.7% |
| DM ex-US Shares (VXEA) | 31.86 | +14.7% | +0.7% |
| VIX Volatility (VVIX) | 113.53 | -7.6% | -19.2% |
| Credit market | |||
| Trezoris (MOVE) | 81.68 | -16.8% | +0.5% |
| HY (VIXHY) | 228.59 | -10.2% | -6.0% |
| IG (VIXIG) | 41.53 | -13.6% | -11.7% |
| Currencies | |||
| EUR/USD (EURUSDV1M) | July 18 | -9.9% | -5.1% |
| Raw materials | |||
| Oil (OVX) | 96.14 | +7.1% | -7.2% |
| Gold (GVZ) | 37.04 | -14.6% | +8.1% |
Cross-Asset Volatility
Source: Bloomberg, Freedom Broker analysis
From a macro perspective, investors’ attention over the past two weeks has centered on a single data release—the March U.S. employment report. The economy added roughly 178k nonfarm jobs, well above consensus (~60k), while the unemployment rate declined to 4.3%; however, a lower labor-force participation rate partly explains the drop. Overall, the data paints a mixed but broadly stable picture, which many macroeconomists view as further justification for the Fed to delay rate cuts, given that the labor market no longer exhibits the pronounced weakness seen earlier.
Market Focus
The key development just outside our two-week review window was Donald Trump’s April 7 announcement of a two-week truce with Iran to allow for negotiations. WTI crude prices fell 16.4% on April 8, reacting to reports that the framework would include reopening the Strait of Hormuz to shipping. That reopening has yet to occur: Polymarket surveys imply only a 26% probability that traffic through the strait will normalize by the end of April. Over the next two weeks, WTI price action will hinge on the status of the Strait of Hormuz, and the progress of U.S.-Iran talks. A full restoration of oil exports via the strait could push WTI toward $75 per barrel in the near term. Conversely, a resumption of hostilities could trigger an immediate spike above $100 per barrel. These opposing scenarios pose the short-term tail risks. A long-term peace agreement between the U.S. and Iran could drive oil prices below $60 per barrel over a one-month horizon. We expect a rapid rebound in crude, refined products, and LNG production and exports once hostilities end. Recall that OPEC+ members raised production quotas by 206 thousand b/d in April and by the same amount again in May. In our view, OPEC+ could increase quotas by a further 1.2 million b/d in 2026, creating a market surplus and putting additional downward pressure on crude prices.
That said, we remain skeptical of the talks and view them as a temporary pause in hostilities. With Iran’s leadership having been seized by the Islamic Revolutionary Guard Corps (IRGC), U.S. allies in the Middle East are likely to push for the military overthrow of the current regime.
The U.S. oil market remains largely unfazed by disruptions to Middle East exports transiting the Strait of Hormuz. Weekly data as of April 4 show commercial crude inventories up 3.1 million barrels to 465 million—the highest since June 2023—and up 25 million barrels since the onset of the Iran-related crisis. Year-to-date, net product exports average 5.5 million b/d, up 14.4% versus the same period in 2025. Through the April 8 close, the 2026 YTD average Henry Hub natural gas price is 11.7% below the same period in 2025. YTD, prices have fallen 26.1% to $2.70 per million Btu. We expect further downside as storage builds are likely to outpace the five-year average in the coming weeks. The U.S. Department of Energy projects April natural gas demand to decline 10.1% MoM.
Accordingly, the evolution of the “fragile” negotiations remains the investment community’s primary focus, as it will shape expectations for GDP, inflation, interest rates, and the U.S. corporate sector—and, by extension, overall market dynamics.
Another key focus for investors in the coming weeks will be the start of the Q1 2026 earnings season. As usual, the financials—particularly the largest systemically important banks—will kick things off. The sector heads into the season on solid footing: consensus calls for roughly +14% YoY EPS growth in Q1, placing it among the S&P 500’s leaders, behind only IT (+45%) and Materials (+24%). At the same time, top-line growth is projected at about +10% YoY, reinforcing the view that operating momentum remains resilient.
The week of April 13-17 will bring earnings from major financial institutions—Goldman Sachs, BlackRock, JPMorgan, Wells Fargo, Citi, and Bank of America. As early reporters, these firms typically set the tone for earnings season and can set a vector for revaluations across the sector. From a valuation standpoint, financials look balanced: the sector trades at a forward P/E of 14.2x, near its 5-year average (14.5x) and only modestly above its 10-year average (13.8x). Notably, that multiple remains well below the broader market, with the S&P 500 at roughly 20.3x, underscoring that financials are relatively cheap.
In this context, we believe the sector is broadly well positioned for the current earnings season. The largest banks are likely to deliver solid results supported by resilient NIM, a gradual recovery in investment banking activity, robust trading revenues amid elevated volatility, and strong inflows into asset management. Ahead of results, our analysts maintain a constructive view on several names, notably Bank of America (price target: $61) and Wells Fargo ($100). We see more limited upside for Citi and JPMorgan, but view both as high-quality stories, with targets of $135 and $320, respectively.
Technical Broad-Market Analysis
The S&P 500 has shifted from correction mode to a rally. Following a six-day advance of roughly 7%, the index is trading back above its 200-day moving average. The RSI has rebounded from oversold levels to above 50, indicating that buyers have clearly regained control. Key support levels are 6,600 and 6,475. Our base case remains further upside, and any pullback toward these support zones would likely be viewed as a buying opportunity. The primary upside target is the record high near 7,000, with intermediate resistance around 6,950.
Expected Trading Range
We believe the S&P 500 Index is most likely to trade within the 6,600-6,950 range.