
Investment Review №351. S&P 500 Hits New Highs

Vadim Merkulov
Head of Analytics department
Alibaba. Fantastic Prospects
BABA stock is an attractive investment opportunity with a target price of $170
About company
Alibaba (BABA) is a Chinese technology company spanning e-commerce, retail, cloud computing and payments. The group operates the world's largest B2B (Alibaba.com), C2C (Taobao) and B2C (Tmall) marketplaces. Through its affiliate Ant Group, Alibaba also runs Alipay—the payments platform with reach across >1bn users.
| Ticker | BABA |
| Share price at the time of analysis |
$124,40 |
| Target Price |
$170 |
| Current upside |
36,66% |
| Stock against Indexes | Day | Week | Month | Quarter | Year |
| BABA | (3,4%) | (0,9%) | 13,8% | (6,9%) | 7,8% |
| S&P 500 | (0,3%) | (0,1%) | 2,0% | 4,3% | 21,3% |
| Russell 2000 | 0,3% | (0,3%) | 1,7% | 5,5% | 36,6% |
| DJ Industrial Average | (0,3%) | (0,5%) | 2,2% | 8,2% | 22,3% |
| NASDAQ Composite Index | (0,6%) | (0,5%) | 0,6% | 0,7% | 23,7% |
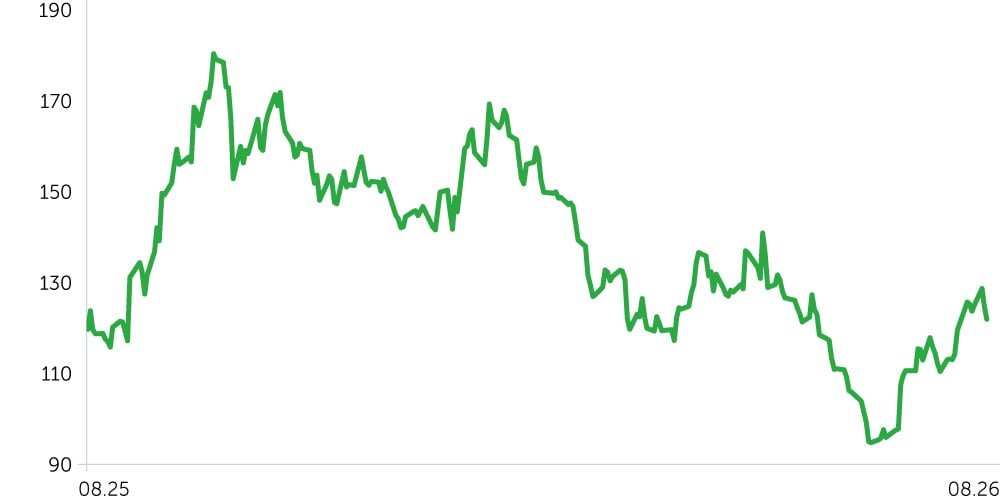
Price dynamics BABA, $
Key Investment Theses
Cloud & AI Growth Inflection. Alibaba’s Cloud & AI business remains a materially underappreciated catalyst for the stock. At the end of FY26, management laid out a five-year plan to scale annual revenue from the segment from ~$23bn today to $100bn, while also flagging a meaningful margin improvement over the next 1–2 quarters. Investors have largely dismissed the targets as ambitious, but we see the setup becoming increasingly asymmetric. Global AI compute demand remains on a steep trajectory, while tighter U.S. controls on access to advanced Anthropic and OpenAI models could accelerate adoption of Chinese AI alternatives globally. Lower-cost Chinese models are steadily narrowing the quality gap with U.S. peers, creating a credible path to share gains and, ultimately, a positive re-rating of BABA’s Cloud & AI franchise.
Government Support for Domestic Demand. A renewed slowdown in China’s economic growth increases the odds of another policy push to revive domestic consumption. Alibaba, as the owner of China’s leading e-commerce platform, is one of the clearest beneficiaries of any incremental stimulus. Recent policy support has increasingly targeted household appliances and consumer electronics—two of BABA’s core e-commerce categories. A pickup in category sales following additional stimulus would provide direct upside to GMV, monetization and earnings expectations, potentially driving positive revisions across the Street.
Domestic Competition Restraint. Alibaba should also benefit from Beijing’s ongoing efforts to curb excessive competition across e-commerce and food delivery, initiatives that have received explicit support from the sector’s major players. A more rational competitive environment should support margin expansion across BABA’s core businesses and improve investor expectations for the company’s earnings trajectory over the coming quarters.
We recommend Buy on BABA, targeting $170, with downside protection at $105.
| Ratio Analysis |
2024A | 2025A | 2026A | 2027E | 2028E | 2029E | 2030E |
| ROE | 9% | 10% | 13% | 15% | 16% | 16% | 16% |
| ROA | 6% | 6% | 8% | 9% | 10% | 11% | 11% |
| ROCE | 4% | 6% | 10% | 11% | 12% | 13% | 13% |
| Sales/Assets (x) | 0,54x | 0,60x | 0,61x | 0,62x | 0,62x | 0,61x | 0,60x |
| Interest Coverage (x) | 5,90x | 8,08x | 12,08x | 13,12x | 14,27x | 15,42x | 16,05x |
| Margins |
2024A | 2025A | 2026А | 2027E | 2028E | 2029E | 2030E |
| Gross margin | 35% | 39% | 39% | 40% | 42% | 42% | 43% |
| EBITDA margin | 18% | 18% | 10% | 13% | 16% | 17% | 18% |
| Net Income margin | 8% | 13% | 10% | 9% | 11% | 12% | 13% |
| Financial Performance, ¥ mn |
2024A | 2025A | 2026A | 2027E | 2028E | 2029E | 2030E |
| Revenue |
941 168 | 996 347 | 1 023 670 | 1 126 037 | 1 244 271 | 1 368 698 | 1 491 881 |
| Cost of sales | 607 915 | 604 621 | 621 215 | 675 115 | 726 114 | 793 251 | 857 184 |
| Gross Income |
333 253 | 391 726 | 402 455 | 450 922 | 518 156 | 575 447 | 634 697 |
| SG&A, R&D | 209 382 | 245 411 | 344 638 | 363 928 | 374 378 | 403 604 | 430 977 |
| EBITDA | 168 807 | 177 166 | 99 963 | 144 021 | 202 139 | 232 204 | 266 912 |
| Depreciation and Amortization | 44 936 | 30 851 | 42 146 | 57 027 | 58 361 | 60 361 | 63 192 |
| EBIT | 123 871 | 146 315 | 57 817 | 86 994 | 143 778 | 171 843 | 203 720 |
| Interest, Other Expenses | 22 275 | -9 140 | -71 570 | -39 137 | -26 811 | -29 492 | -32 147 |
| EBT | 101 596 | 155 455 | 129 387 | 126 131 | 170 589 | 201 335 | 235 866 |
| Taxes, Equity Investments | 30 264 | 29 479 | 27 260 | 22 748 | 28 715 | 32 290 | 38 290 |
| Net Income |
71 332 | 125 976 | 102 127 | 103 384 | 141 874 | 169 045 | 197 577 |
| Diluted EPS | ¥31,24 | ¥53,59 | ¥44,05 | ¥47,25 | ¥67,93 | ¥79,26 | ¥94,38 |
| DPS | ¥7,05 | ¥12,04 | ¥14,03 | ¥11,39 | ¥16,34 | ¥19,81 | ¥23,59 |