Investment Review №346. Riding the Green Wave
Market Environment as of June 1
Global View
During the review period, U.S. equities extended their advance, with gains becoming broader and higher-quality than in the prior two weeks. The NASDAQ-100 rose 5.2%, the Russell 2000 gained 4.7%, the S&P Mid Cap 400 added 3.3%, and the S&P Small Cap 600 rose 3.0%. The S&P 500 Equal Weight Index also delivered a solid 3.2% return, outpacing the cap-weighted S&P 500 (+2.7%). Unlike the preceding period, when mega-cap technology led the market, the latest strength broadened to mid- and small-caps, signaling broader investor risk appetite.
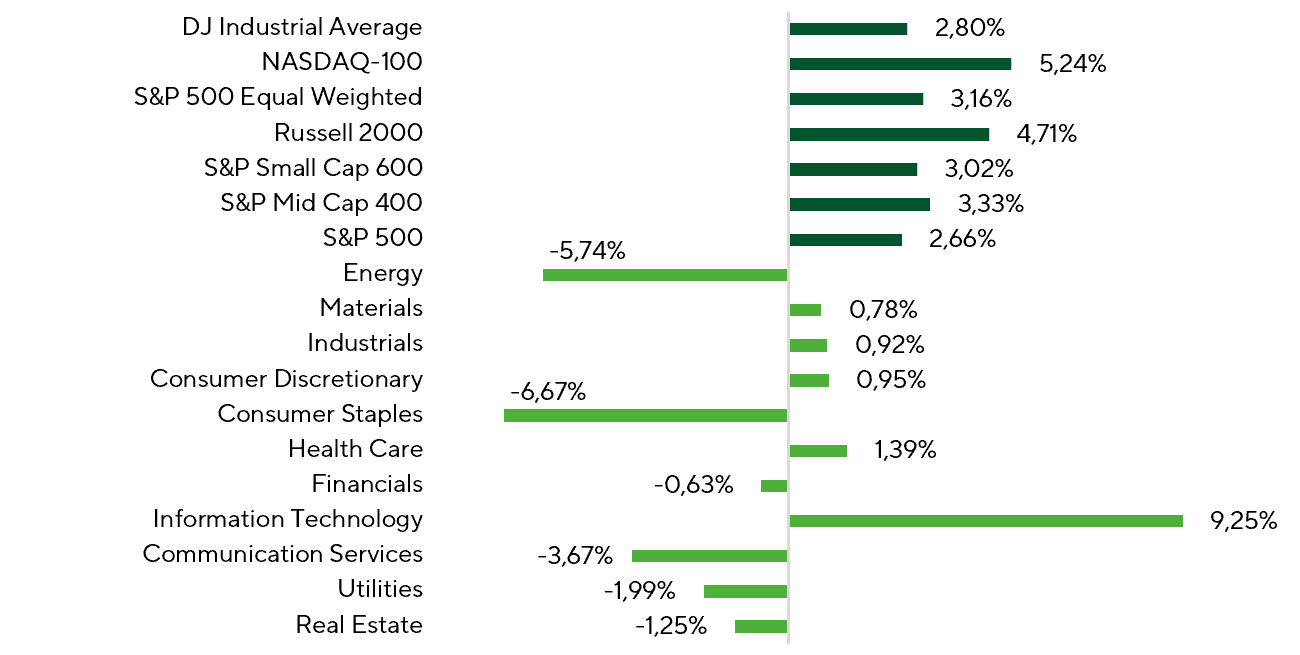
Index and Sector Returns Over the Review Period
Sources: FactSet, Freedom Broker analysis
Market breadth metrics confirm this trend. Despite the S&P 500’s strong performance, only 54.7% of its constituents posted positive returns during the period. By contrast, 69.8% of Russell 2000 names advanced—one of the best results among major indices. Thus, while the Nasdaq 100 again led in absolute returns, small caps delivered the broadest participation. Notably, only 60% of the 15 largest S&P 500 companies rose, down from 86.7% two weeks earlier. This points to a market that is less dependent on a narrow group of mega caps, with demand more evenly distributed across sectors and sizes.
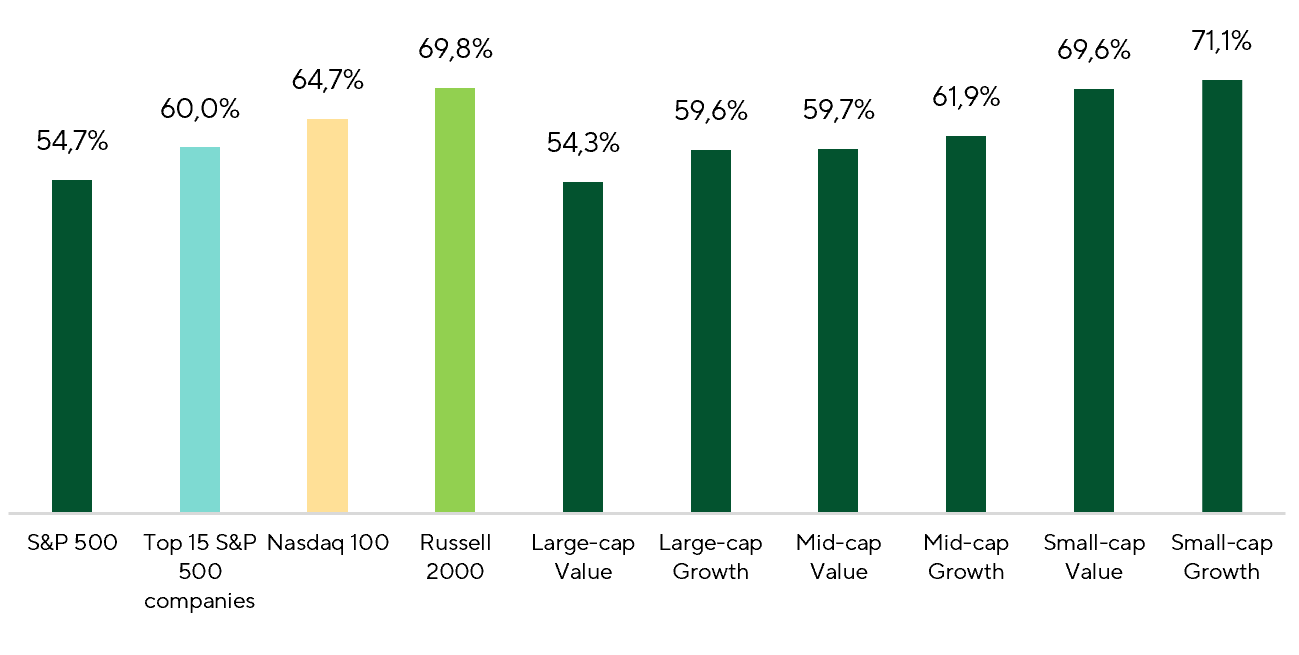
Index Constituents (%) with Positive Returns Over the Review Period
Sources: FactSet, Freedom Broker analysis
At the sector level, IT was again the clear leader, rising 9.3%. The advance was exceptionally broad-based: 86.3% of sector constituents posted gains, the strongest breadth across S&P 500 sectors. Semiconductor makers, software providers, and AI infrastructure firms remained key drivers. Robust quarterly results from tech companies further underscored high demand for computing power, cloud services, and enterprise automation software. Broad participation was also evident across Consumer Discretionary and Communication Services, where 80% and 68% of constituents, respectively, closed the period higher. By contrast, Energy was the period’s notable laggard: only 16.7% of companies advanced amid softer crude prices and profit-taking after strong gains in prior months.
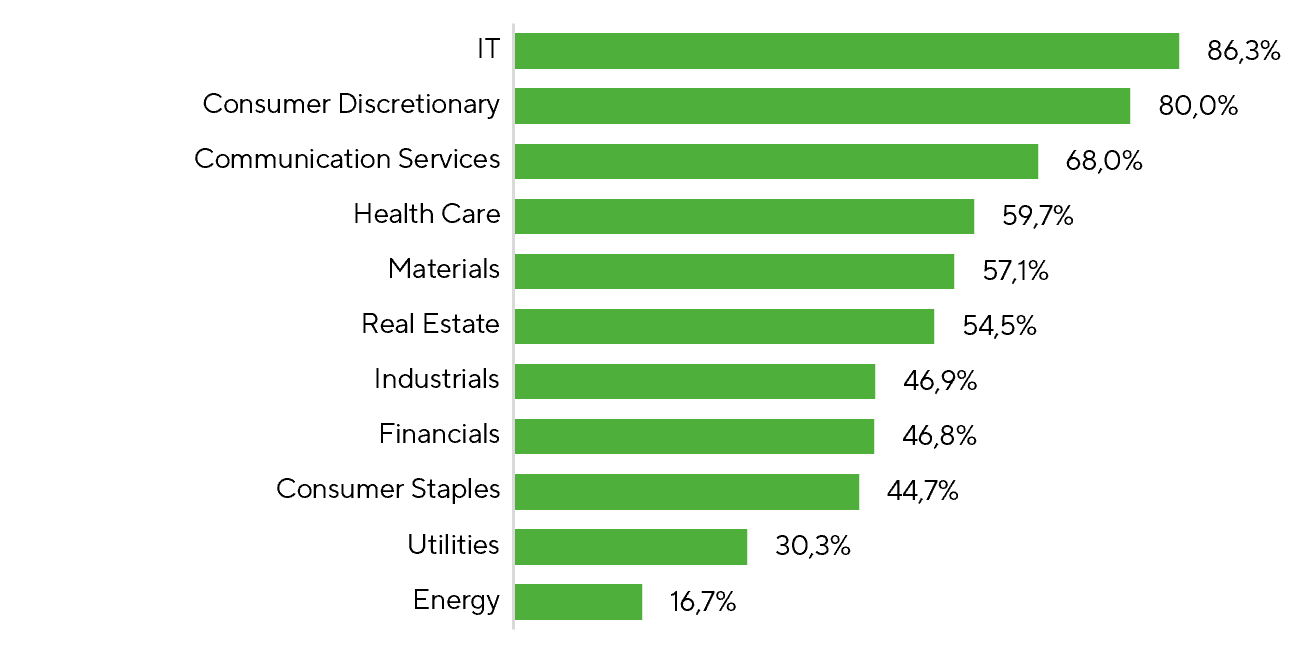
S&P 500 Constituents (%) with Positive Returns by Sector Over the Review Period
Sources: FactSet, Freedom Broker analysis
The memory-chip segment, one of the strongest areas of the semiconductor industry in 2026, deserves a closer look. The DRAM ETF has risen 145% since its launch, while individual names have delivered even stronger gains. The primary growth driver has been surging demand for memory from AI infrastructure. Whereas the first wave of investor interest centered on AI-accelerator and GPU manufacturers, the market is increasingly focusing on the components without which modern AI systems cannot scale. The step-up in compute is driving a sharp increase in demand for HBM and server DRAM for AI clusters and data centers. In this context, major cloud providers continue to ramp up infrastructure capex, enabling memory suppliers to raise prices and secure long-term supply agreements.
Micron stands out as a clear beneficiary of this trend. The company has indicated that its entire 2026 HBM output is already sold out, and investors increasingly view it as a key supplier of memory for AI infrastructure. Notably, at the end of May, Micron’s market capitalization surpassed $1 trillion for the first time, reflecting a significant upward revision to expectations for long-term AI-driven memory demand.
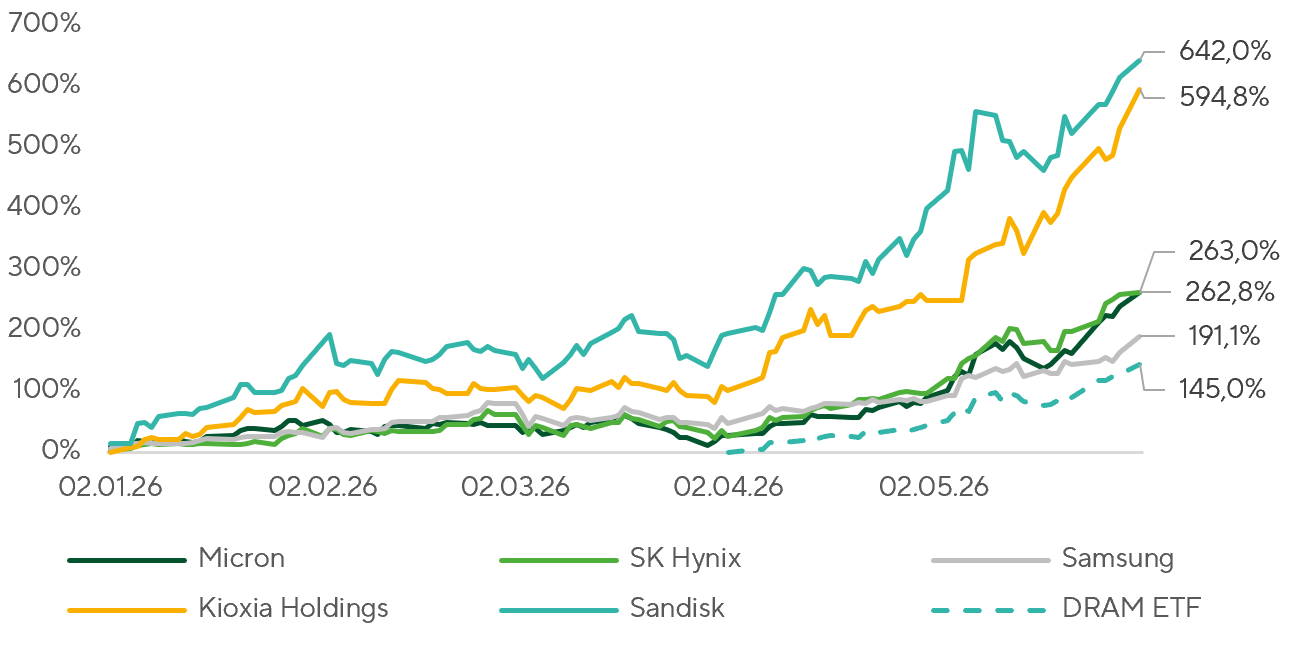
YTD Performance: DRAM ETF and Top Memory Manufacturers
Sources: FactSet, Freedom Broker analysis
The Consumer Staples sector was among the period’s notable laggards, declining 6.7%. Weakness was driven by results from the sector’s largest constituents. Despite resilient consumer demand, investors reacted negatively to Walmart’s softer earnings outlook amid intensifying price competition and rising costs. For Costco, the market focused on margin pressure and a lack of incremental catalysts following a prolonged stretch of stock outperformance. As a result, investors continued to take profits in traditional defensive segments and rotated toward companies with clearer growth drivers, leaving the sector with one of the weakest performances over the review period.
Market Focus
The earnings season for Q1 2026 is effectively complete. According to FactSet, 97% of S&P 500 companies have already reported, with 85% beating EPS estimates and 81% exceeding revenue expectations, which is the best result since 2021. The average positive EPS surprise is 16.7%, and the index’s aggregate earnings growth is 28.6% YoY, the highest since Q4 2021. The main contributions came from IT and Communication Services—particularly Alphabet, Meta, Nvidia, Microsoft, and Amazon. Another positive sign: Q2 estimates continue to be revised up. Since the end of March, the S&P 500’s Q2 EPS consensus estimate has risen about 2.5%, bucking the usual pattern of analysts trimming forecasts as the quarter progresses.
Oracle (ORCL) is scheduled to report Q4 FY26 results after the market close on June 10. This follows a strong Q3, when revenue rose 22% YoY to $17.2bn, non-GAAP EPS reached $1.79, and RPO increased to $553bn. Bloomberg consensus calls for revenue of about $19.1bn, EPS of $1.97, and nearly 20% constant-currency revenue growth. The central debate remains the same: how quickly the record AI contract backlog converts into revenue, and whether data center buildouts increase pressure on FCF and leverage. The external backdrop heightens the importance of this print. According to Reuters, Oracle and OpenAI have postponed some elements of their Texas expansion, though the 4.5 GW program remains on track, and financing for a $16bn data center in Michigan is nearing completion. As a result, investors will be focused not only on EPS but also on management’s commentary around the timing of capacity additions, capex, and AI workload margins. Shares have already rallied meaningfully in recent months, but confirmation of robust OCI demand and funding discipline could further bolster confidence in ORCL. The consensus price target stands at $249.
Adobe (ADBE) will report for Q2 FY26 on June 11. The company enters the print after a strong start to the year: last quarter, revenue rose 11% YoY to $6.4bn, driven by Acrobat, Express, Creative Cloud Pro, and enterprise Customer Experience Orchestration solutions. Investor attention will center on the pace of AI monetization. ARR of Adobe’s new AI offerings more than tripled YoY, Firefly generative credit consumption increased over 45% QoQ, and monthly active users across the ecosystem surpassed 850 million. The enterprise segment remains an additional tailwind, with ARR of GenStudio and Adobe Experience Platform growing over 30% YoY amid robust demand for marketing automation and AI‑based content creation. Meanwhile, investors will monitor ongoing pressure on Adobe Stock, the company’s legacy business, as users shift toward generative content. Even so, Firefly’s strong momentum, an expanding user base, and solid enterprise demand support a constructive outlook ahead of the print. The consensus price target for ADBE stands at $320.
Among the macro events during the review period, investors focused on U.S. personal income and spending data, as well as the PCE deflator—the Fed’s preferred inflation gauge. Overall, the data were market-friendly: personal spending rose 0.43% MoM in April, beating Street expectations, while core PCE increased 0.24% MoM versus the 0.3% consensus. Together, these figures indicate that, despite ongoing pressure from higher oil prices and tariffs, inflation so far shows no signs of re-acceleration.
By contrast, the personal income data was noticeably softer. Incomes were unchanged from the prior month in April, versus expectations for a 0.4% MoM increase. Income growth has been running below the pace consistent with sustainable economic expansion for some time. On the one hand, this constrains firms’ ability to pass higher costs on to consumers, helping to contain inflation. On the other, persistent pressure on household incomes remains a key risk to consumer activity in the coming quarters.
On the geopolitical front, markets were focused not on a single conflict but on three interlinked flashpoints: the Strait of Hormuz, Iran’s nuclear program, and the Israel–Hezbollah front in Lebanon. Near term, Hormuz remains the key macro channel: roughly one-fifth of global oil and LNG flows typically transit the strait. Over the past two weeks, crude fell below $100 per barrel as investors priced in the prospect of a narrow interim deal—an extended truce, a partial reopening of the waterway, and a lower risk premium on oil. The negotiations, however, remain fragile. The parties are sending mixed signals, no durable agreement has been reached, and fresh U.S. strikes on Iranian military targets near Bandar Abbas have quickly restored some upward pressure on oil prices. Even a Hormuz deal would not resolve the underlying strategic issues: the trajectory of Iran’s uranium enrichment, the disposition of its 60% enriched stockpile, its missile program, and the role of its regional proxies. Markets recognize this. Polymarket pricing implies only a 16–27% probability of a U.S.–Iran peace deal in mid- to late June, and those odds have been drifting lower in recent weeks—signaling waning confidence in a swift peace, even if a tactical pause remains possible.
Broad Market Technical Analysis
The S&P 500 continued to set fresh record highs, reaching the 7,620 area before encountering moderate profit-taking. Momentum remains strong, but the near-vertical advance leaves the market vulnerable to short-term consolidation. The RSI has slipped back toward 70 after a recent peak near 77; watch for potential divergence and signs of momentum fatigue if the index attempts another leg higher. The nearest support has shifted to 7,500, with the 20-day moving average nearby. Below that, 7,300–7,330 remains a key zone; a deeper pullback into this area would likely offer a more attractive entry for longs. A break above 7,620 would open the path to further highs, but the base case is sideways consolidation following the strong run-up. Market breadth has improved slightly: the S&P 500 Equal Weight Index outperformed the cap-weighted benchmark over the period, and the share of constituents above their 50-day moving averages expanded from 47% to 51%.
Expected Trading Range
We expect the S&P 500 to trade within a 7,330–7,700 range.