
Investment Review №350. A Shift in Priorities
Market Environment as of July 27
Global Perspective
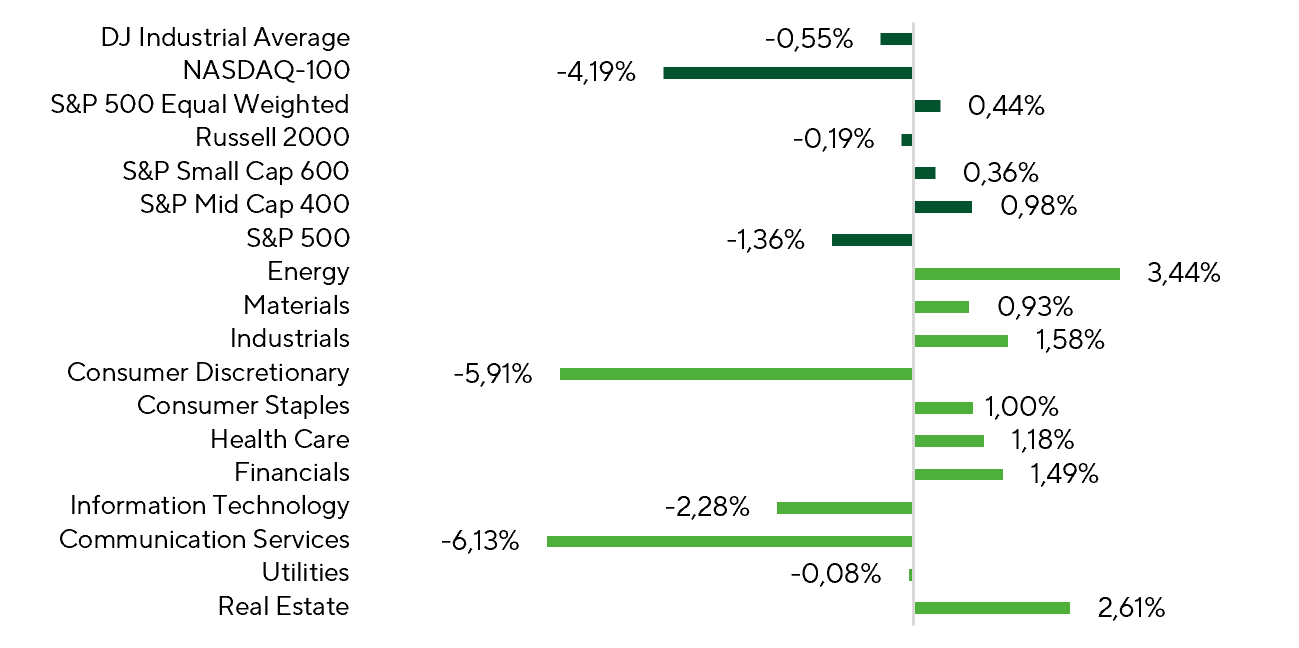
Index and Sector Performance Over the Review Period
Source: FactSet, Freedom Broker analysis
U.S. equities delivered another split performance over the review period. The S&P 500 fell 1.36%, while the Nasdaq 100 dropped 4.19%, making it the weakest-performing major benchmark. Beneath the headline indices, however, market breadth continued to improve. The equal-weighted S&P 500 gained 0.44%, the S&P MidCap 400 rose 0.98%, and the S&P SmallCap 600 advanced 0.36%, signaling a continued rotation away from concentrated mega-cap leadership.
The Dow Jones Industrial Average declined 0.55%, while the iShares Russell 2000 ETF edged 0.19% lower.
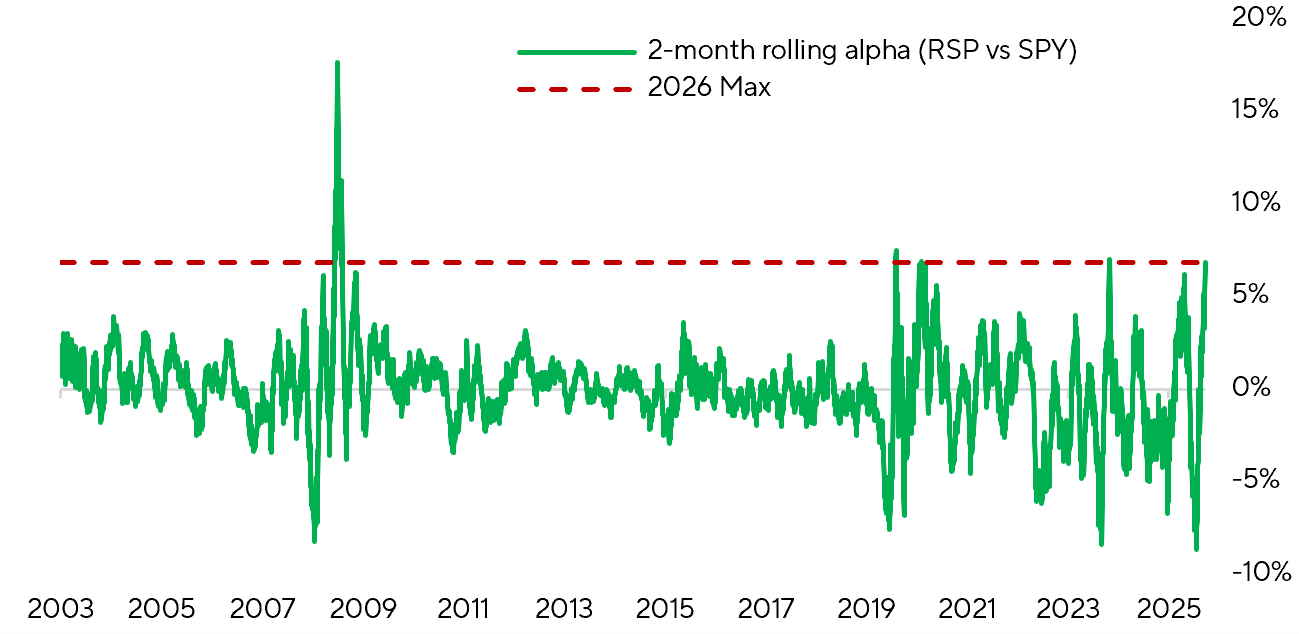
Equal-Weight S&P 500 (RSP) Outperformance vs. the S&P 500 (SPY), Two-Month Rolling
Source: FactSet, Freedom Broker analysis
The relative performance of the equal-weighted S&P 500 (RSP) versus its cap-weighted counterpart (SPY) provides another clear signal that market breadth is improving. RSP’s rolling two-month excess return has climbed to 6.9%, placing it near the upper end of its range over the past two decades. Comparable bursts of equal-weight outperformance were recorded in September 2024, late 2020 through early 2021, June 2020, and the post-crisis recovery following 2009.
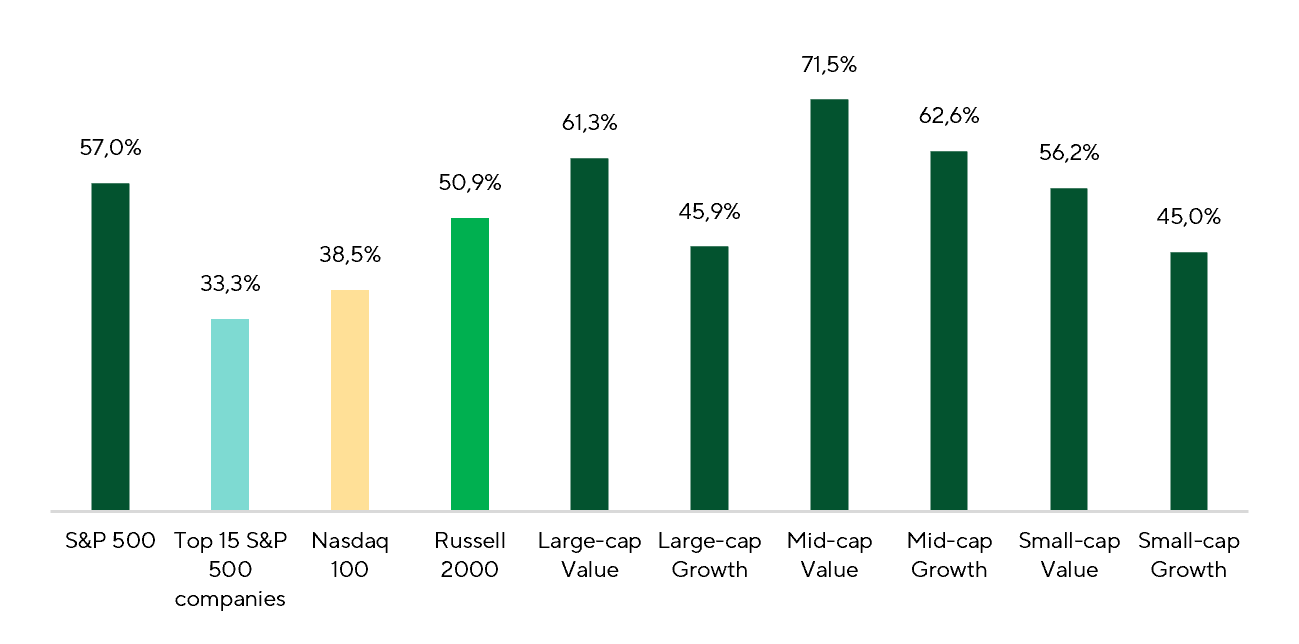
Share of Index Constituents Posting Positive Returns Over the Review Period
Source: FactSet, Freedom Broker analysis
Communication Services was the weakest-performing sector, falling 6.1% over the review period. Losses were concentrated among the largest hyperscalers, with Alphabet down 7.4% and Meta sliding 9.6%. Together, the two stocks represent a significant share of the sector index. The sharpest leg lower followed Alphabet’s earnings release. The company raised its infrastructure capex guidance, which investors interpreted as a negative read-through for the broader AI complex. Sentiment was further pressured by free cash flow turning negative for the first time in the company’s history. The selloff quickly spread across the hyperscaler trade. Information Technology declined 2.3%, while
Consumer Discretionary fell 5.9%, with the latter also dragged lower by weakness in Amazon, another major spender on AI infrastructure.
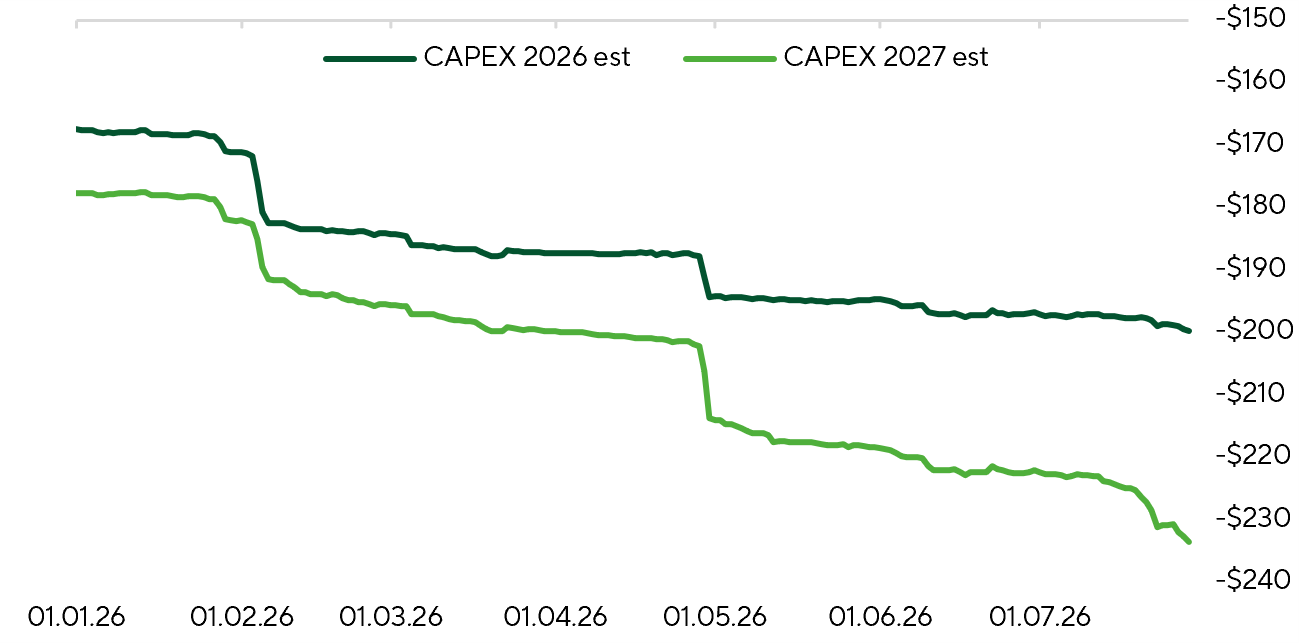
S&P 500 Capex Expectations
Negative sentiment intensified after The Wall Street Journal reported that Nvidia is in talks to provide OpenAI with up to $250bn in financing for data-center development. Investors are increasingly concerned not only about another leg higher in AI infrastructure capex, but also about circular financing structures, in which capital circulates among a small group of interconnected players, sustaining reported demand for equipment and services without a corresponding increase in external end demand. Against this backdrop, market attention has shifted to the growing financial commitments across the AI value chain and whether companies can fund infrastructure expansion without materially impairing balance-sheet strength. These concerns have also spilled into credit markets. Nvidia’s credit default swap spreads widened sharply over the past month to approximately 75 bps. Similar moves were recorded across the major hyperscalers, reflecting rising investor caution over the scale and funding burden of their capex programs.
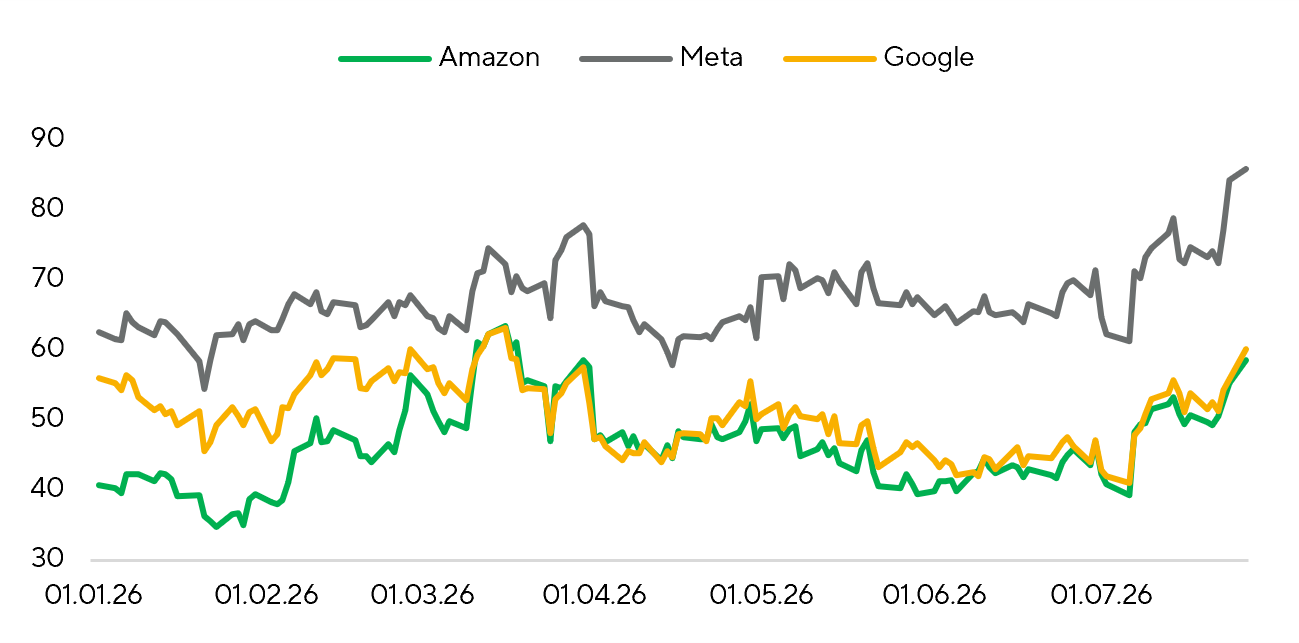
Hyperscaler Bond Spreads Over Treasuries (G-Spread)
Source: FactSet, Freedom Broker analysis
Despite growing unease around AI infrastructure spending, the market still delivered one standout event: the successful IPO of Chinese memory-chip manufacturer CXMT. The stock surged more than 400% on its first day of trading, lifting the company’s market capitalization to approximately $460bn. CXMT estimates that it held around 7% of the global memory market in 2025, trailing industry leaders Samsung, Micron and SK Hynix. With the market still highly concentrated, investors continue to seek alternative listed names offering diversified exposure to structural growth in AI-driven memory demand. That enthusiasm is already embedded in the valuation. CXMT trades at approximately 20x forward earnings, compared with a range of roughly 5.0x–12.3x for its largest peers. The market is assigning a substantial premium to the company’s growth potential and its prospects of emerging as a credible alternative to the incumbent leaders. Sanctions risk remains a key overhang, however, and could trigger a sharp one-off correction in the shares.
The rotation into defensive sectors also points to a broader shift in how investors are pricing business quality. The market is increasingly rewarding companies capable of generating resilient free cash flow today—a preference consistent with a higher-for-longer rate environment, where lofty valuations based on distant cash flows become harder to sustain. In that sense, the current rotation looks less like a broad risk-off move and more like a repricing of the cost of capital, with funds shifting toward sectors offering greater earnings visibility and more predictable near-term cash generation.
On the macro front, June retail sales confirmed that consumer demand remained resilient as inflation moderated. Headline sales rose 0.2% MoM, in line with consensus, while gasoline-station spending fell 5.3% MoM as fuel prices declined. Excluding gasoline, core sales increased 0.8% MoM. Control-group sales, a key input into current GDP estimates, rose 0.54% MoM, slightly above the 0.5% consensus forecast. The key message was that spending momentum remained firm without a meaningful resurgence in price pressure. As gasoline prices declined and core inflation held flat, consumers continued to increase spending, led by sporting goods, leisure products and online retail. Food, apparel, and health and personal-care categories lagged. From January through June, control-group sales increased by an average of 0.7% MoM, while the ex-gasoline core measure averaged 0.6% MoM—well above the pace recorded in 2025. Slower inflation is therefore creating more room for real consumption growth and reinforcing expectations for solid U.S. GDP expansion in the third quarter.
Market Focus
Over the next few weeks, investors are likely to remain focused on geopolitics and the ongoing earnings season.
Oil market volatility has surged over the past two weeks amid renewed escalation in the Middle East. The U.S. has resumed strikes against Iran, while Tehran has responded with missile and other attacks, and Washington has simultaneously reinforced its military presence in the region. In the Red Sea and the Bab el‑Mandeb Strait, Yemeni Houthi attacks on transiting tankers have disrupted oil supply logistics, heightening shipping risks along one of the world’s key transport routes.
Against this backdrop, oil prices rose in the second half of July. WTI briefly topped $90 per barrel—the highest since early June—in line with our prediction in the prior biweekly report. Hydrocarbon market tightness has intensified in recent weeks, driven by a renewed blockade of Iranian ports and reduced traffic through the Strait of Hormuz; Houthi attacks on Saudi tankers; and lower exports from Russia and Kazakhstan amid Ukrainian strikes on energy infrastructure and tankers.
The U.S. strategic petroleum reserve continues to draw down rapidly: since hostilities in the Strait of Hormuz began, inventories have fallen by 107.4 million barrels (or 25.9%). We expect elevated price volatility to persist into early August. If current conditions hold—with export disruptions extending beyond the Strait—prices could remain above $90 per barrel, while any escalation could push WTI toward $100. Conversely, a normalization of shipping through the Strait could trigger a sharp pullback toward $70. On Sunday, August 2, OPEC+ is likely to raise September production quotas by 188 kb/d; year to date, the group has increased quotas by a cumulative 976 kb/d.
The continuing earnings season will be closely watched. To date, 241 S&P 500 constituents have reported, representing roughly half the index by count. Results are running well ahead of Wall Street expectations: 69.3% have beaten revenue estimates and 86.7% have topped EPS projections. Aggregate year-over-year EPS growth is tracking at 49.4%, materially above what was expected a couple of weeks ago. Consensus, however, assumes the growth rate will moderate as more companies report, with aggregate EPS growth ultimately settling near +40% YoY.
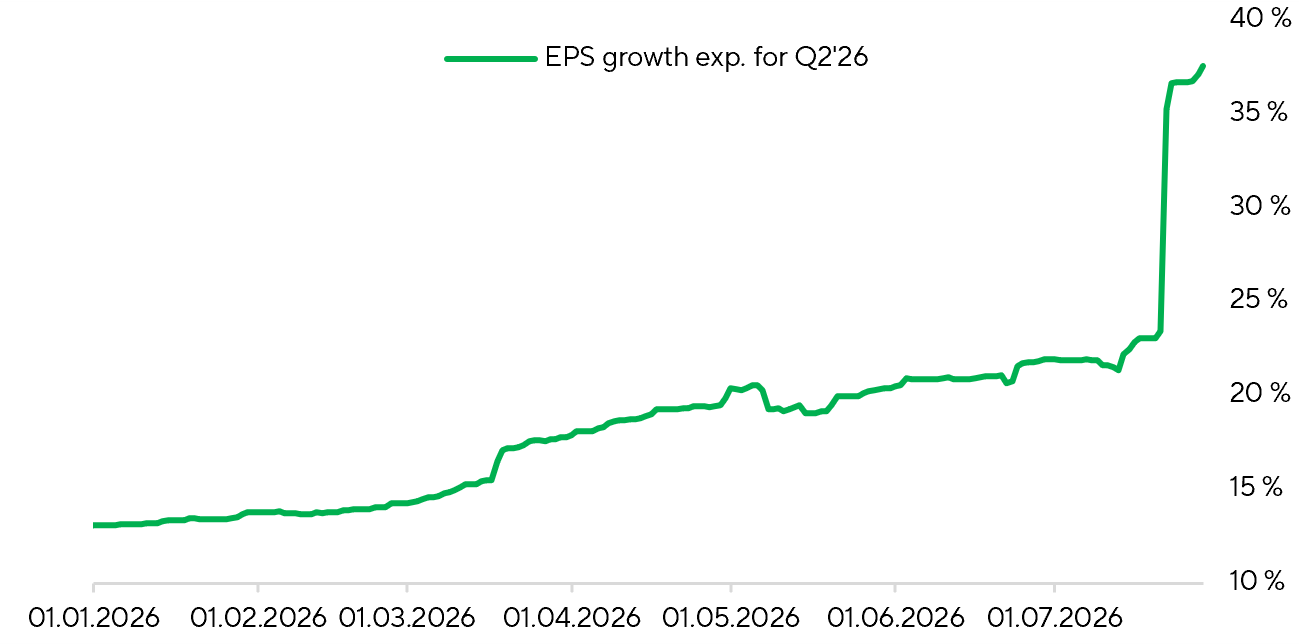
S&P 500: Q2’26 EPS Expectations Trends
Sources: Bloomberg, Freedom Broker analysis
Over the next 10–11 days, another 137 index constituents will report results, with analysts highlighting several releases likely to attract elevated investor interest.
AMD reports for Q2’26 on August 4, following a strong Q1: revenue rose 38% YoY to $10.3bn and adjusted EPS increased 43% to $1.37, topping market estimates. Growth was led by the data center business, where revenue surged 57% YoY to $5.8bn on robust demand for EPYC server CPUs and Instinct AI accelerators. The client and gaming segment also contributed, with revenue up 23% to $3.6bn on strong Ryzen sales and continued market-share gains. For Q2, management guides revenue of about $11.2bn (±$300m), implying roughly 46% year-over-year growth, and expects an adjusted gross margin of about 56%. Investors will focus on the cadence of Instinct shipments, data center revenue momentum, gross‑margin durability, and management’s commentary on demand from major cloud customers. The Street’s consensus price target for AMD is $547.
Eli Lilly will report Q2’26 results on August 5, following an exceptionally strong first quarter: revenue rose 56% YoY to $19.8bn, adjusted net income jumped 155% to $7.7bn, and adjusted EPS reached $8.55 (+156% YoY), reflecting accelerating growth in the core business. Mounjaro and Zepbound remained the primary drivers—Mounjaro sales surged 125% YoY to $8.7bn, while Zepbound sales grew 80% to $4.2bn despite lower selling prices. Shipment growth and international sales expansion continue to more than offset pricing pressure, particularly across diabetes and obesity treatments. New products in immunology, oncology, and neuroscience are also delivering strong revenue growth. For full 2026, management raised guidance to $82–85bn in revenue and $35.50–$37.00 in adjusted EPS, indicating momentum should persist in the second half of the year. Heading into the report, investors will closely monitor the sales growth trajectory of Mounjaro and Zepbound, the impact of price concessions, progress with the launch of oral therapy Foundayo, and continued manufacturing capacity ramp-up. The current consensus price target for Eli Lilly is $1,307.
Broad Market Technical Analysis
The S&P 500 index pulled back sharply from the upper boundary of its consolidation range, breaking below the 20- and 50-day moving averages and a short-term ascending trend line. The RSI slipped to 38, signaling intensifying downside momentum, though conditions are not yet oversold. Market breadth remains relatively resilient: the share of constituents above their 50-day moving averages expanded to 66%, suggesting the sell-off is not yet confirmed by the broader market.
The near-term outlook has turned moderately negative. Initial support sits near 7,290, followed by 7,235 and 7,180. Stabilization would require a sustained move back above 7,465–7,530, where the moving averages and prior support line are now running.
Expected Trading Range
We expect the S&P 500 to trade in a 7,180–7,530 range.