
Двухнедельный обзор фондовых рынков №349. Большие надежды
Market Environment as of June 29
Global View
U.S. market performance over the past two weeks was again highly uneven. Index weakness was driven mainly by a correction in mega-cap technology stocks: the S&P 500 fell 1.51%, while the Nasdaq-100 lost 2.52%. Broader market breadth was stronger. The Dow Jones rose 0.99%, the equal-weighted S&P 500 gained 0.46%, the iShares Russell 2000 ETF added 1.47%, the S&P Small Cap 600 advanced 2.77%, and the S&P Mid Cap 400 rose 0.48%.
Small- and mid-caps again delivered the strongest results, while the equal-weighted S&P 500 looked notably more resilient than the cap-weighted benchmark, highlighting lower dependence on mega-cap technology. At the sector level, Health Care led gains, rising 5.62%, followed by Utilities at +3.46% and Industrials at +2.59%. Financials and Real Estate also posted moderate gains. Communication Services came under the most pressure, falling 4.57%, followed by Information Technology at -4.11%. Materials and Energy lost 3.17% and 3.00%, respectively, while Consumer Discretionary and Consumer Staples also finished lower.
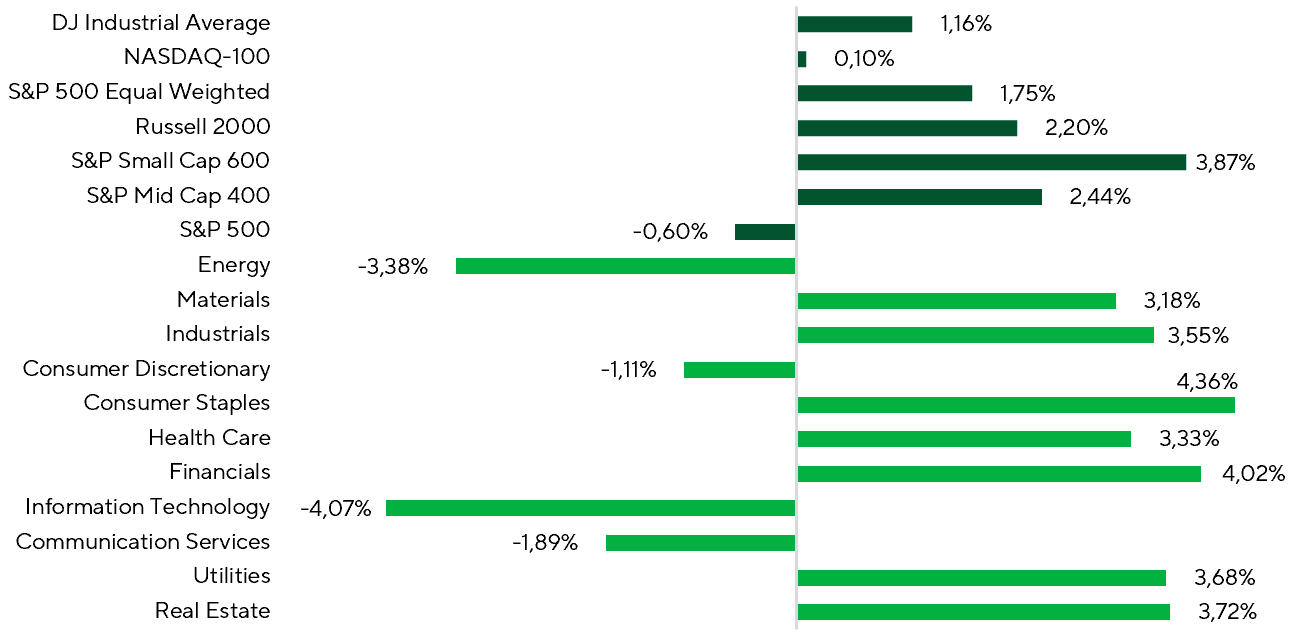
Index and Sector Performance Over the Period
Sources: FactSet, Freedom Broker analysis
Market breadth, however, remained stronger than the headline indices suggest. A total of 58.9% of S&P 500 constituents posted positive returns, compared with only 40% among the 15 largest companies in the index. In many ways, mega-cap technology led the market lower, including Nvidia, Apple, Alphabet, Microsoft, Amazon, Broadcom, and Meta. That was a key reason why the S&P 500 and Nasdaq-100 underperformed other parts of the U.S. market.

Share of Companies Delivering Positive Returns Across Indices Over the Period
Sources: FactSet, Freedom Broker analysis
At the sector level, the rally was also fairly broad, though uneven. More than 75% of companies ended the period in positive territory in Utilities, Health Care, and Real Estate. By contrast, the share was only 38.4% in Information Technology and 36.0% in Communication Services, while Materials stood at 42.9%.
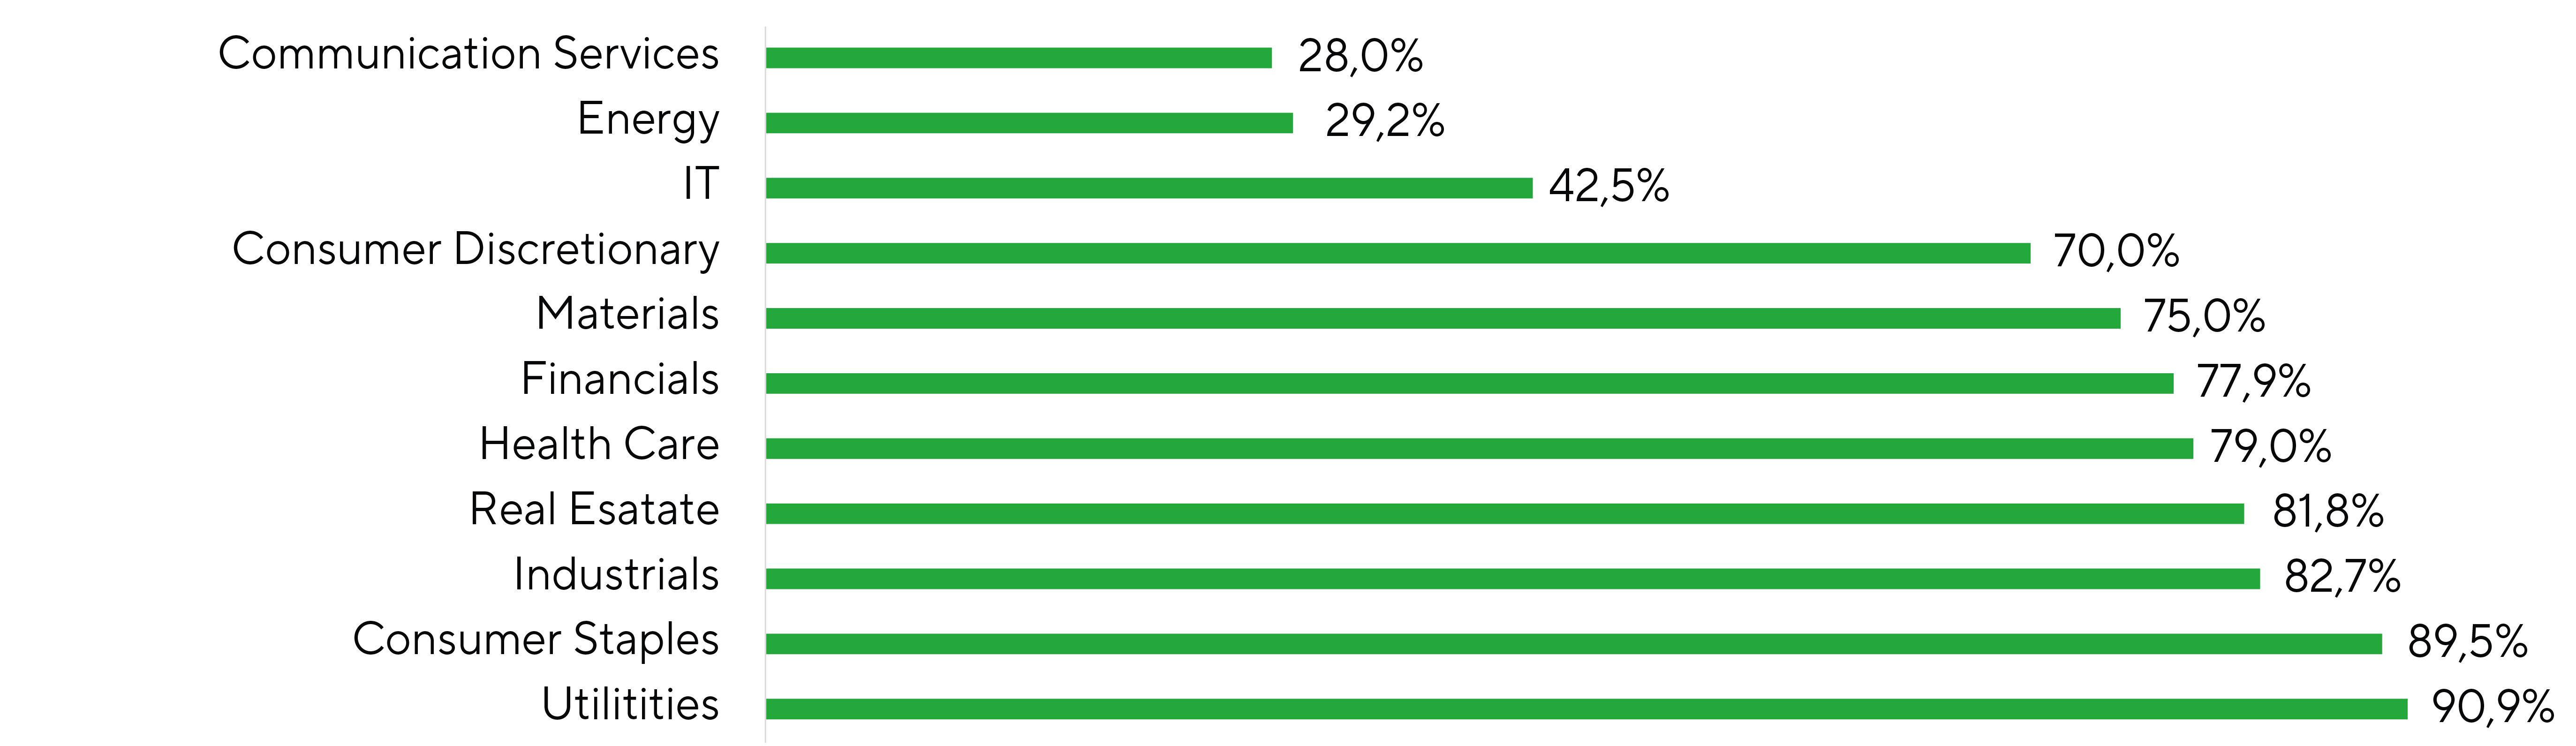
Share of S&P 500 Companies Delivering Positive Returns Across Sectors Over the Period
Sources: FactSet, Freedom Broker analysis
One important driver of the rotation into rate-sensitive areas is the prospect of summer disinflation. The market is gradually starting to price a scenario in which lower oil prices and a related drop in short-term inflation expectations trigger a chain reaction: a reassessment of the Fed rate path and stronger demand for risk assets, including the segments most sensitive to interest rates.
In Q2, the correlation between oil prices and one-year inflation expectations stood at 0.70, indicating a high degree of synchronization. In other words, the market’s pricing of the inflation spike was shaped largely by energy-market developments. Short-term rolling-correlation analysis shows local spikes and pullbacks, but the relationship remained fairly stable throughout the quarter.
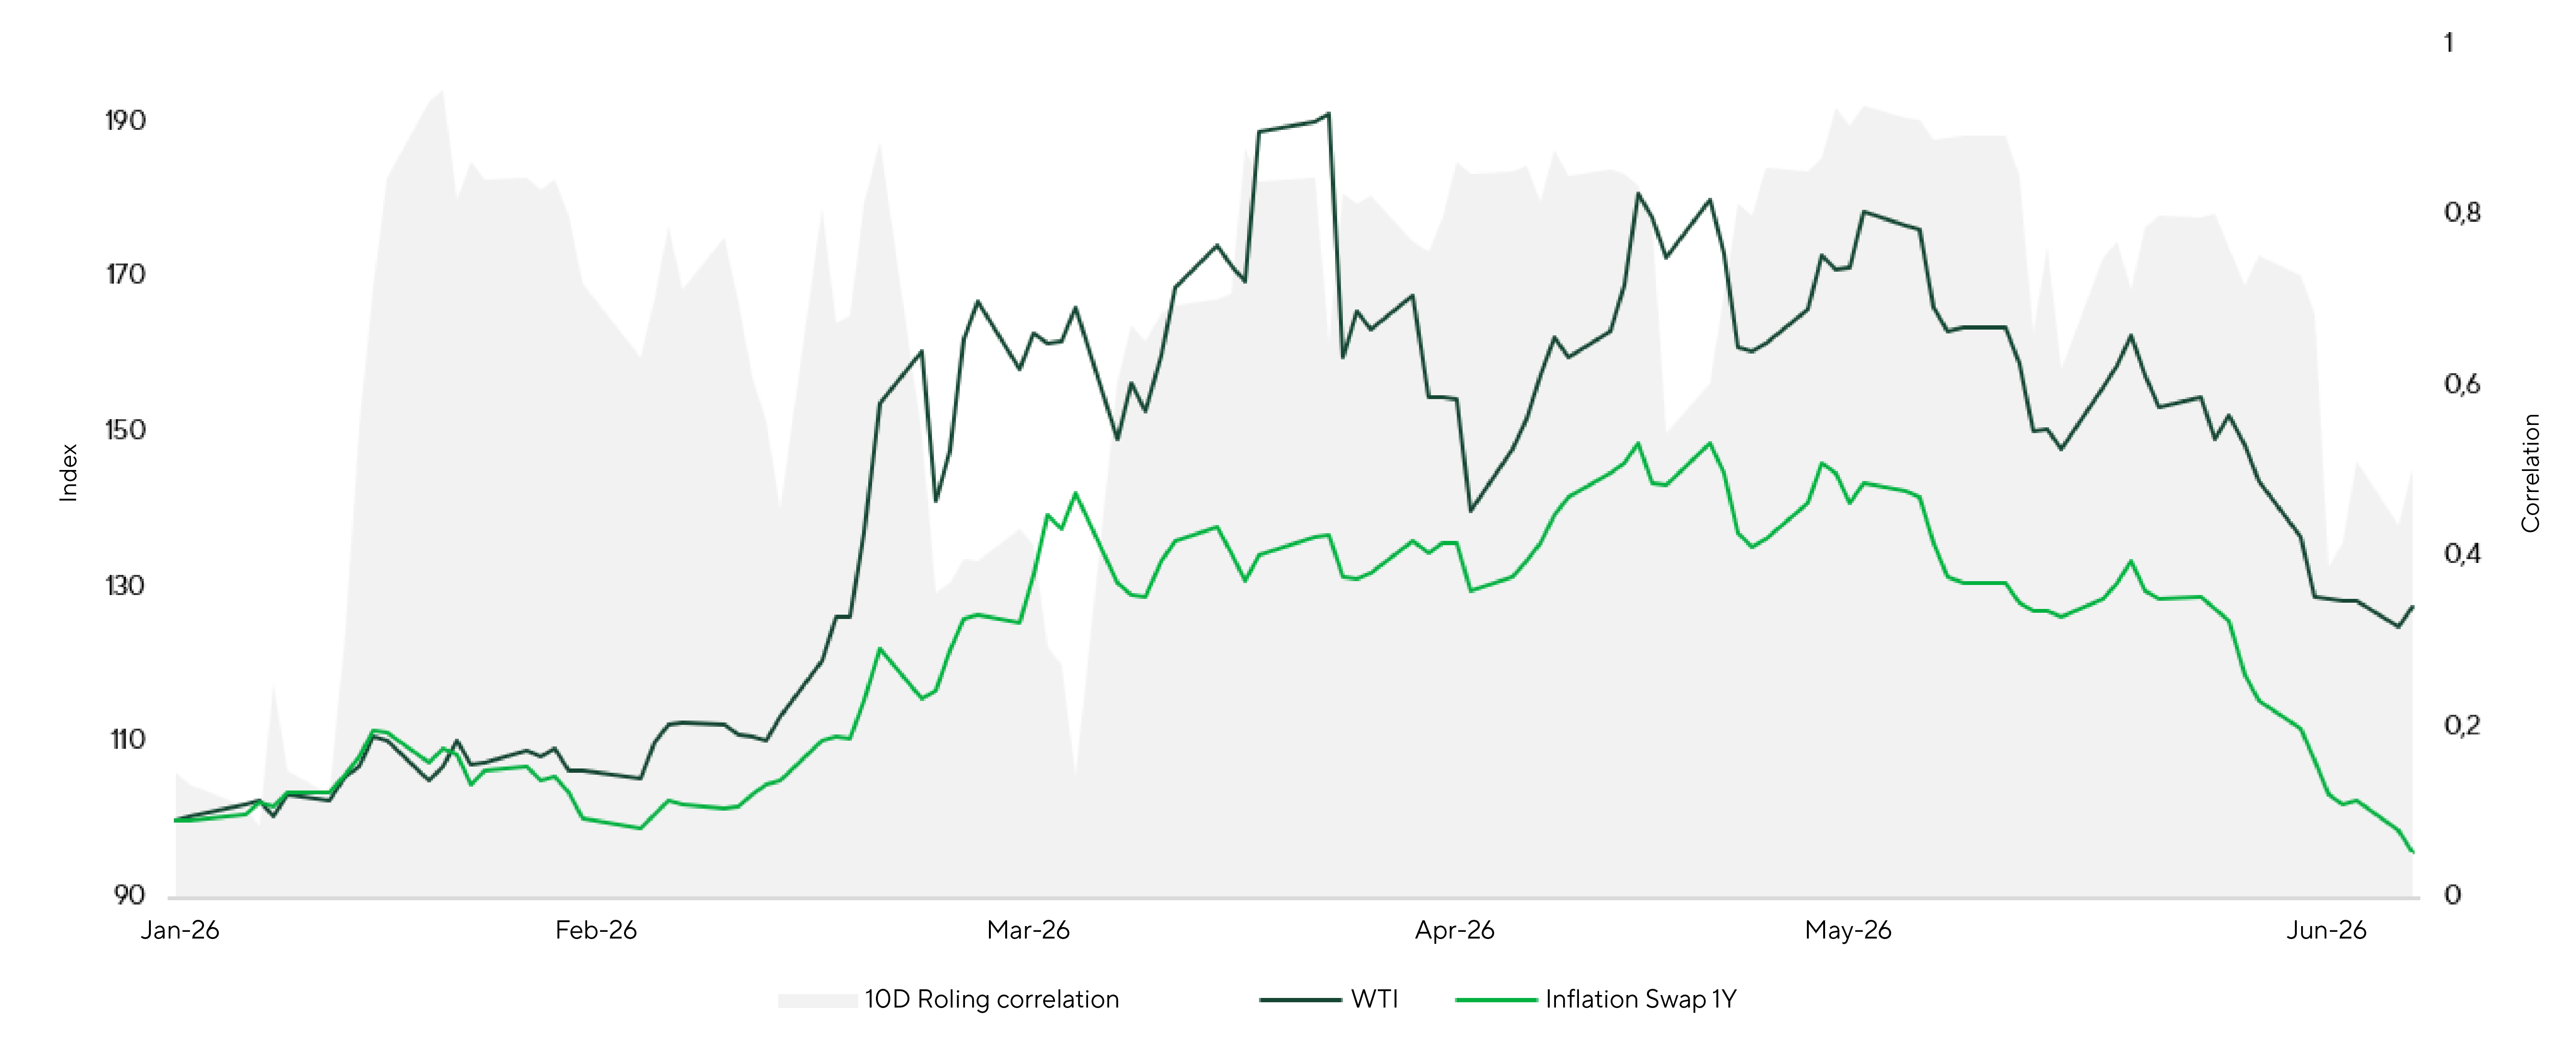
WTI vs. 1Y Inflation Swap and 10-Day Rolling Correlation
Source: Bloomberg, Freedom Broker analysis
Moving from inflation expectations to the implied Fed rate path, the key point is that lower inflation expectations pass through to rate expectations with a lag. For now, the futures market is pricing a 25 bp rate hike as early as the October meeting, with a 98.6% probability. In our view, however, the Fed’s current stance, as communicated at the latest meeting, signals caution rather than a genuine intention to resume or intensify tightening.
Fed funds futures appear to reflect more of a sentiment reset after the inflation and oil shocks than a durable shift in the macro picture. In our view, this behavioral factor is keeping rate expectations elevated despite a high probability that inflation cools in June and, all else equal, continues to ease in July.
Short-term correlation analysis points to no stable relationship between inflation expectations and rate expectations, with the 10-day correlation hovering near zero. Still, a clearer trend has been visible since the start of the year, with the two variables maintaining a positive link. The current setup therefore looks more like a local lag before a potential repricing of the rate path as inflation expectations cool. In our view, the market is still underestimating the probability of summer disinflation and is waiting for confirmation from hard macro data, primarily CPI and PCE.
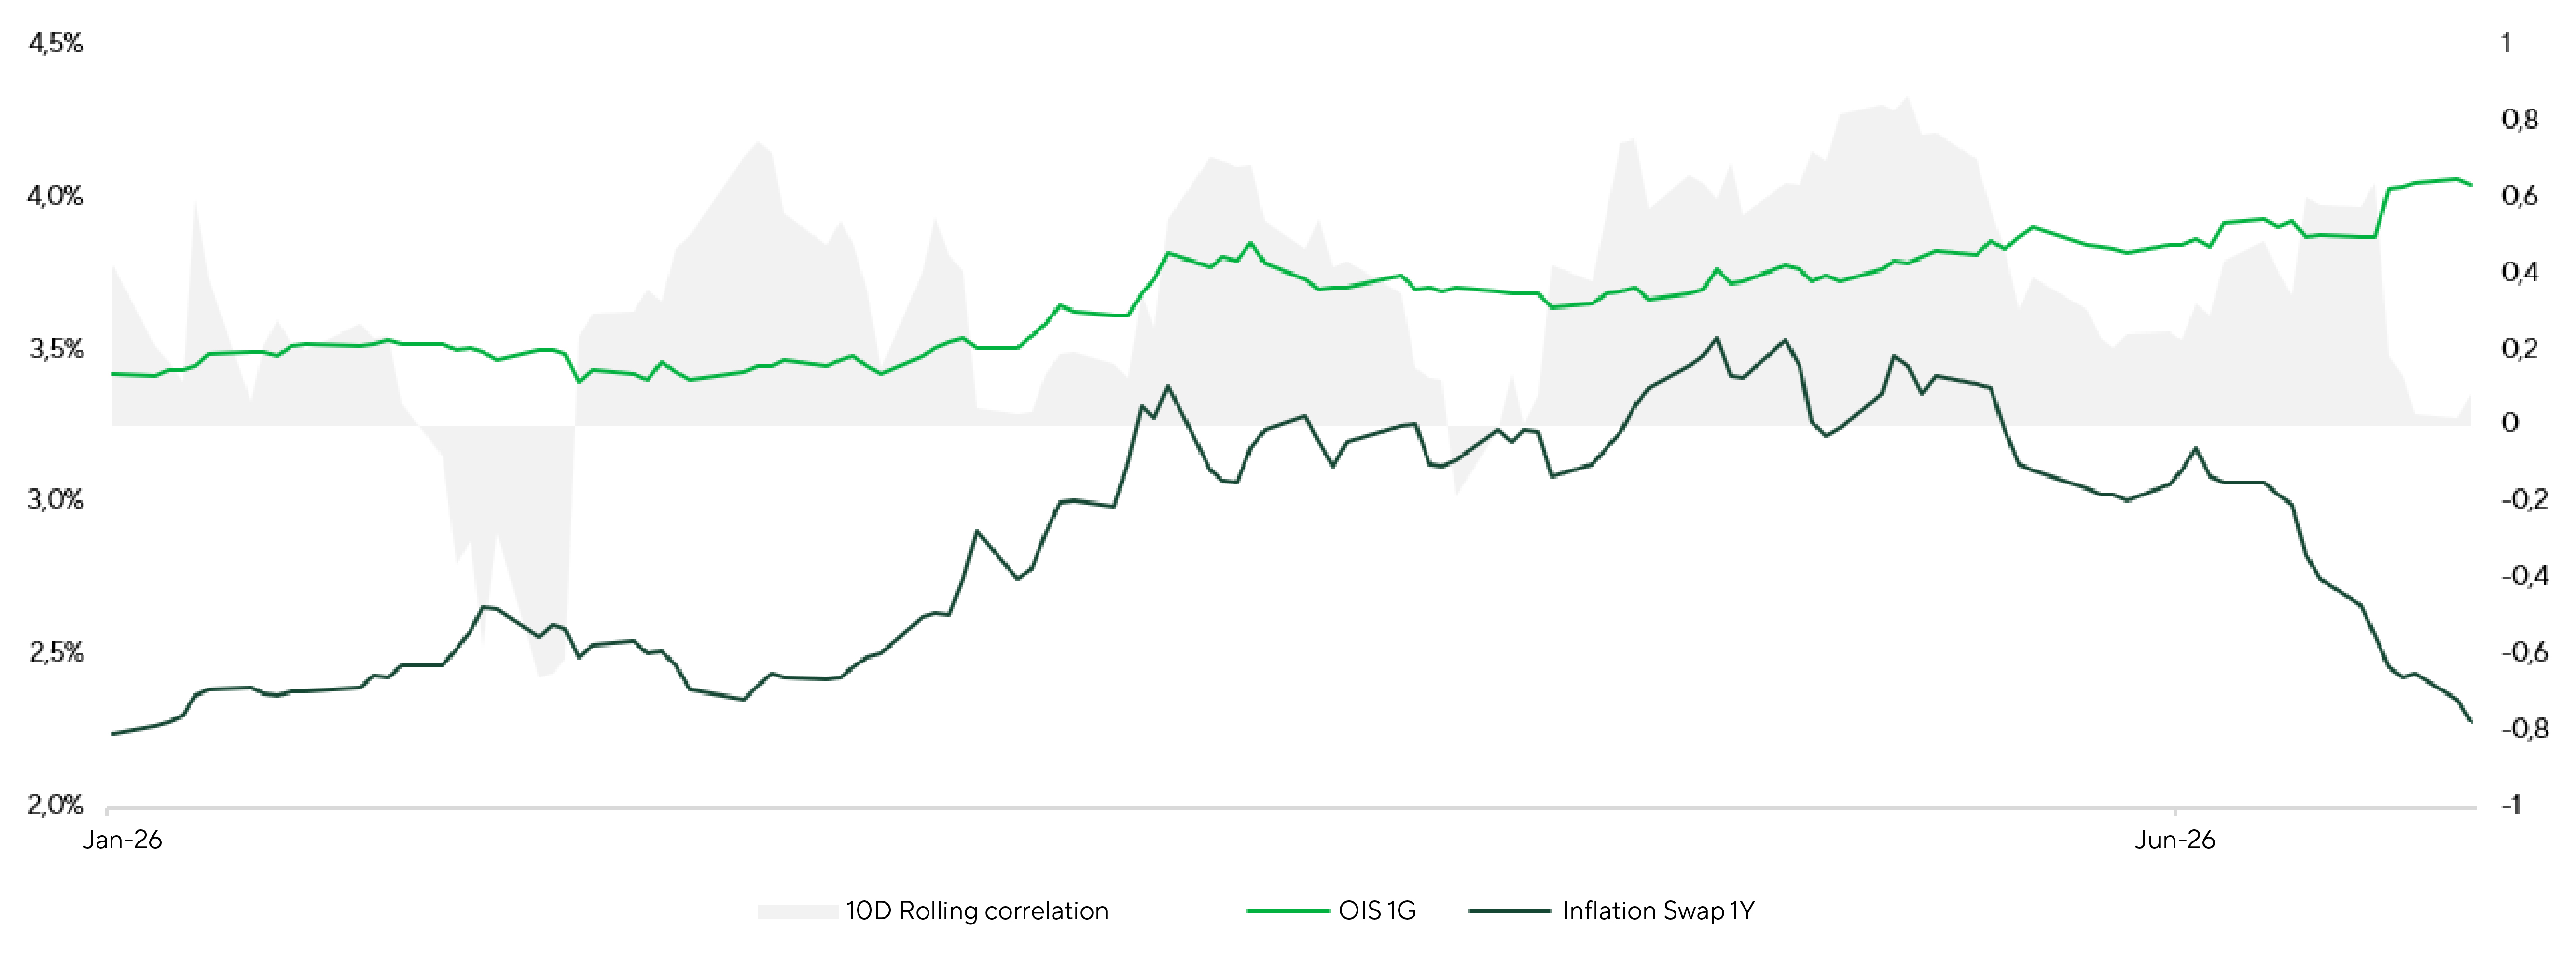
OIS vs. 1Y Inflation Swap and 10-Day Rolling Correlation
Source: Bloomberg, Freedom Broker analysis
From a macro perspective, investors also focused on the May retail sales report released ahead of the Fed meeting. The data came in well above expectations, pointing to resilient consumer demand. Headline retail sales rose 0.9% MoM versus the 0.6% consensus, core retail sales excluding autos and gasoline increased 0.5% MoM compared with expectations of 0.3%, while the control group—a key input for GDP calculations—advanced 0.7% MoM, also well above the 0.3% forecast. On a YoY basis, headline retail sales grew 6.9%, while the control group expanded 6.3%. A notable feature of the May report was that the upside surprise was not driven solely by higher gasoline prices. Although sales at gasoline stations jumped 3.4% MoM, the bulk of the strength came from a broad range of merchandise categories despite a 0.1% MoM decline in core goods prices. Furniture, electronics, and appliance sales rose 0.4% MoM, while health and personal care products increased 0.6% MoM. Positive momentum was also recorded across sporting goods, leisure products, department stores, and e-commerce. Overall, the report pointed to a broad-based recovery in goods consumption during May that was not accompanied by stronger pricing pressure.
Investors also focused on the release of the May PCE inflation report. The data came in broadly in line with expectations but still provided a modestly constructive signal on the broader inflation trajectory. Headline PCE rose 0.45% MoM versus the median forecast of 0.5%, while core PCE, which excludes food and energy, increased 0.32% MoM, broadly matching expectations of 0.3%. On a YoY basis, headline PCE accelerated to 4.07%, while core PCE came in at 3.41%.
The data were broadly in line with consensus, but in aggregate still pointed to a slightly more favorable-than-expected inflation backdrop. However, the internal composition of the report was less clear-cut, as services once again emerged as the primary source of inflationary pressure. Goods categories showed only marginal deviations from expectations, while services inflation accelerated to 0.45% MoM, broadly matching the early-year spike and pushing the average pace of price increases in this segment for January–May above 2025 levels.
Against this backdrop, the end of the oil shock is unlikely to represent a key source of medium-term inflation risk, while it may exert disinflationary pressure over the summer months. Over the medium term, the primary focus should remain on the persistence of pricing pressure in the services sector.
Market Focus
Over the next ~1.5 weeks, the market is expected to continue assessing whether the recent rotation into rate-sensitive segments can be supported by fundamentals. As previously noted, much will depend on how inflation is priced over the summer months and whether expectations begin to reprice from a more restrictive policy path toward a neutral trajectory.
On July 14, June inflation data is scheduled for release. The consensus anticipates core inflation to ease from 2.9% in May to 2.8% in June, while headline inflation, including food and energy, is expected to decline more noticeably from 4.2% to 3.9%. This could potentially serve as a starting point for a broader disinflationary trend over the summer months and reinforce rotation into cyclical and rate-sensitive segments.
Despite potential upside from the inflation release, the market is likely to remain cautious toward the IT sector. The key post-rally concern centers on the sustainability of the scale of the investment cycle tied to artificial intelligence infrastructure. Large cloud platforms continue to increase capital expenditures, driven by ongoing data center construction, procurement of specialized chips, expansion of cloud capacity, and build-out of computing infrastructure required for AI model workloads.
In absolute terms, cash flow from operations at major hyperscalers—AMZN, GOOG/GOOGL, META, MSFT, and ORCL—remains robust. However, an increasing share of CFO is being absorbed by capex. In other words, both actual and projected operating cash flow cover CapEx, but with a narrower margin. This shift has become a key investor focus and could heighten volatility across the IT sector, particularly as capital rotates toward more conservative and defensive exposures.
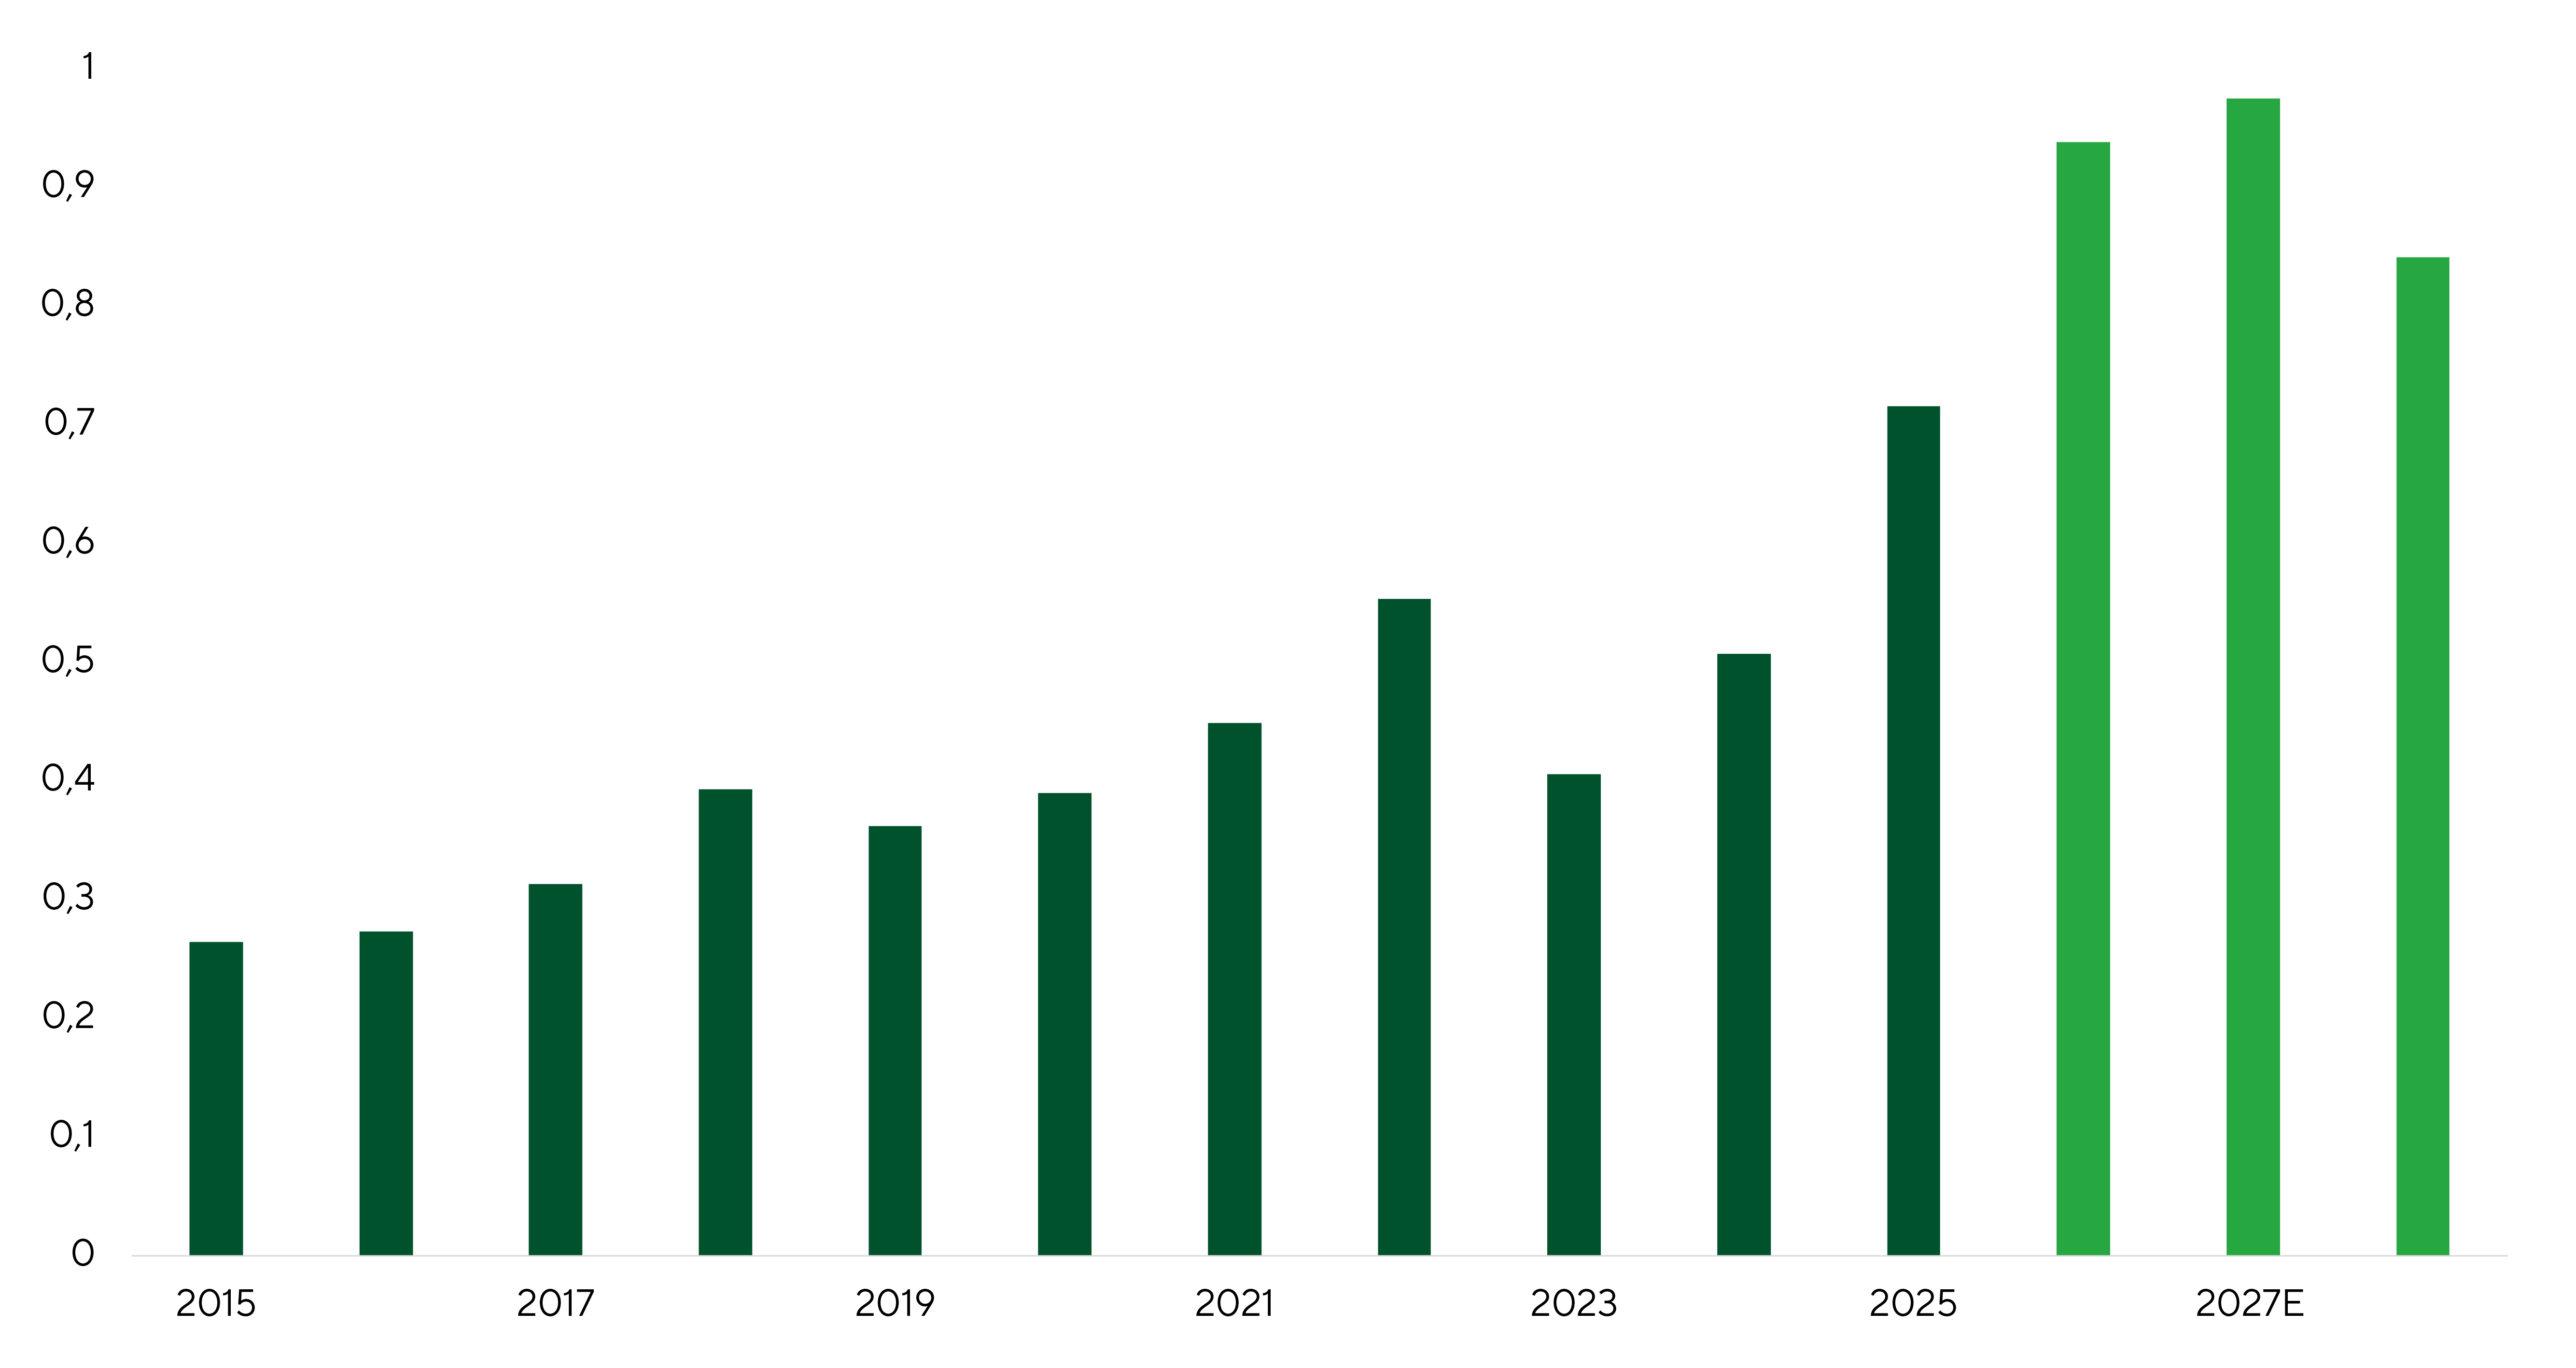
Hyperscalers’ Capex-to-CFO Ratio
Source: Bloomberg, Freedom Broker analysis
Another key catalyst will be the Q2’26 earnings season, which traditionally begins with major banks. The market enters the reporting period with lofty expectations: S&P 500 earnings are projected to rise 23.3% YoY. Below are several reports to watch.
On July 14, 2026, JPMorgan Chase will report Q2 results. The bank heads into earnings after a very strong first quarter and remains one of the most stable, diversified banks in the U.S. Last quarter, net income stood at $16.5bn, revenue reached $50.5bn, and return on tangible equity was 23%, underscoring robust performance despite gradually declining interest rates and ongoing expense growth. Resilient net interest income, a large deposit base, and broad diversification across retail, corporate, investment banking, and trading remain key supports. A strong capital markets footprint, growing fee income, and steady demand for asset management should continue to help in Q2. Investors will closely monitor provision builds/releases, loan quality, expenses, the net interest income outlook, and management’s comments on H2 business activity. The consensus price target for JPMorgan Chase is $348.
Also on July 14, 2026, Bank of America will release its Q2 report. The company’s first quarter was solid, with improvements across most major segments. Net income amounted to $8.6bn, revenue was $30.3bn, and return on tangible equity rose to 16%, reflecting the operating model’s resilience amid fee-income growth and a gradual recovery in net interest income. Key drivers include loan growth, higher client activity, and strong positions in trading, investment banking, and asset management. In Q1, average deposits rose to $2.02tn, average loans and leases increased to $1.19tn, and net interest income grew 9% YoY to $15.7bn. Investors will keep an eye on the trajectory of interest income, loan quality, expenses, and management’s commentary on consumer activity and the H2 operating environment. The consensus price target for Bank of America is $63.53.
Broad Market Technical Analysis
The S&P 500 remains in consolidation, but the technical setup for the back half of June has improved meaningfully. The index rebounded from the lower boundary of the 7,240–7,300 support band and resettled above the 20- and 50-day moving averages. Market breadth also improved: the share of constituents above their 50-day MAs rose to 63% from 53%. Accordingly, we shift our short‑term stance from neutral to neutral positive. The closest resistance is at 7,525–7,550 near the upper edge of the local descending channel; the next pivotal level remains the 7,620 high. A sustained break above 7,620 would confirm the return of buyers and open a path to new highs. Key support shifts to roughly 7,300; while above this level, the base case remains a resumption of the uptrend once consolidation ends. A deeper pullback toward 7,240–7,300 is possible but remains an alternative, not the base case.
Expected Trading Range
We expect the S&P 500 to trade between 7,300 and 7,620.