
Investment Review №350. A Shift in Priorities

Vadim Merkulov
Head of Analytics department
Nike. Sports Betting
NKE stock is worth buying, with a target price of $55
About company
Nike Inc. (NYSE: NKE) is a global leader in the athletic footwear and apparel industry, supported by one of the world's most recognizable brands. The company generates annual revenue exceeding $46 billion. Founded in 1964, Nike is headquartered in Beaverton, Oregon.
| Ticker | NKE |
| Share price as of analysis | $42,07 |
| Target share price | $55,00 |
| Growth potential | 30,7% |
| Share price dynamics vs. indices | Day | Week | Month | Quarter | Year |
| NKE | 1,7% | -4,7% | -0,3% | 1,6% | -44,7% |
| S&P 500 | 0,0% | -0,6% | 0,7% | -1,2% | 16,5% |
| Russell 2000 | -0,3% | -1,1% | -1,9% | -3,1% | 30,1% |
| DJ Industrial Average | -1,0% | -1,6% | 0,1% | -0,9% | 15,7% |
| NASDAQ Composite Index | -0,6% | -2,1% | -2,0% | -4,7% | 18,6% |
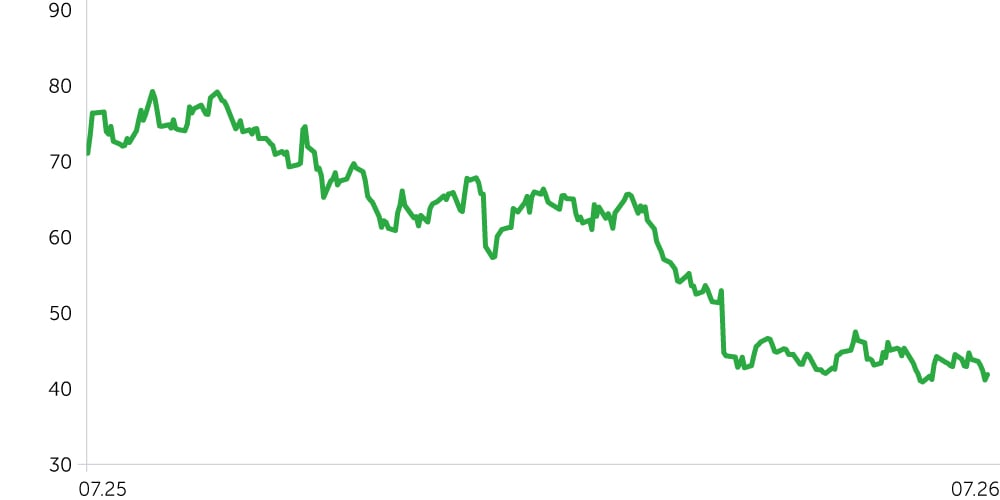
Price dynamics NKE, $
Key Investment Theses
Improving Operating and Financial Performance. While footwear sales in Greater China continue to decline at a double-digit rate, management has been actively addressing the issue and has already delivered encouraging early results. In the U.S., Nike's domestic market, footwear sales increased by 5% year-over-year. A key driver of margin improvement was an approximately $1 billion benefit related to the reinstatement of the IEEPA. The company also maintains a net cash position exceeding $1 billion, providing ample financial flexibility to execute its strategic initiatives. Although Nike has faced increasing competition in the mass-market segment across certain regions, the company is repositioning its brand toward the premium market while optimizing its direct-to-consumer sales strategy.
High Short Interest. Nike currently has approximately 63 million shares sold short, representing about 5.5% of the free float and roughly three days of average trading volume. A potential short squeeze could trigger a sharp, short-term appreciation in the share price.
Attractive Entry Point. Nike shares have declined by approximately 35% year-to-date and remain nearly 75% below their peak reached over the past five years. The stock is a constituent of both the Dow Jones Industrial Average (DJIA) and the S&P 500, as well as several sector-specific indices. As index funds rebalance their portfolios, passive investment flows may increase demand for Nike shares, providing additional technical support for the stock.
Attractive Dividend Yield. Nike pays a quarterly dividend and has consistently increased its dividend over time. The current dividend yield is approximately 4%, which provides additional downside support for the shares.
We recommend buying Nike (NYSE: NKE) with a target price of $55 per share, implying approximately 30% upside from the current market price. To manage downside risk, we recommend placing a stop-loss at $34 per share.
| Ratio Analysis | 2023A | 2024A | 2025A | 2026E | 2027E | 2028E | 2029E | 2030E |
| ROE | 36% | 40% | 24% | 21% | 22% | 26% | 25% | 24% |
| ROA | 14% | 15% | 9% | 8% | 9% | 11% | 11% | 11% |
| ROCE | 17% | 18% | 10% | 11% | 11% | 13% | 13% | 13% |
| Revenue / assets (x) | 1,36x | 1,35x | 1,27x | 1,21x | 1,17x | 1,17x | 1,16x | 1,15x |
| Margin | 2023A | 2024A | 2025A | 2026E | 2027E | 2028E | 2029E | 2030E |
| Gross margin | 43,52% | 44,56% | 42,73% | 42,91% | 43,54% | 44,64% | 44,74% | 44,84% |
| EBITDA margin | 13,47% | 14,28% | 9,83% | 9,89% | 10,97% | 12,66% | 12,76% | 12,86% |
| Net profit margin | 9,90% | 11,10% | 6,95% | 6,70% | 7,65% | 9,11% | 9,26% | 9,41% |
| Financial Metrics, $m | 2023A | 2024A | 2025A | 2026A | 2027E | 2028E | 2029E | 2030E |
| Revenue | 51 217 | 51 362 | 46 309 | 46 398 | 46 644 | 48 413 | 49 892 | 51 422 |
| Cost of revenue | -28 925 | -28 475 | -26 519 | -26 487 | -26 335 | -26 801 | -27 570 | -28 363 |
| Gross profit | 22 292 | 22 887 | 19 790 | 19 911 | 20 309 | 21 612 | 22 322 | 23 058 |
| SG&A | -16 097 | -16 348 | -16 012 | -16 061 | -15 986 | -16 304 | -16 804 | -17 321 |
| Operating income | 6 195 | 6 539 | 3 778 | 3 850 | 4 323 | 5 308 | 5 518 | 5 737 |
| Interest expense (income) | 6 | 161 | 107 | 50 | 121 | 191 | 241 | 293 |
| Earnings before tax | 6 201 | 6 700 | 3 885 | 3 900 | 4 444 | 5 499 | 5 759 | 6 030 |
| Tax | -1 131 | -1 000 | -666 | -792 | -878 | -1 086 | -1 138 | -1 192 |
| Net income | 5 070 | 5 700 | 3 219 | 3 108 | 3 566 | 4 412 | 4 621 | 4 839 |
| Earnings per share (diluted) |
$3,23 | $3,96 | $2,16 | $2,10 | $2,41 | $3,03 | $3,24 | $3,46 |
| EBITDA | 6 898 | 7 335 | 4 553 | 4 591 | 5 116 | 6 131 | 6 367 | 6 612 |
| Assets | 37 531 | 38 110 | 36 579 | 38 410 | 39 784 | 41 330 | 42 931 | 44 695 |
| Short-term debt | 6 | 1 006 | 5 | 2 000 | 0 | 0 | 1 500 | 0 |
| Equity | 14 004 | 14 430 | 13 213 | 14 865 | 16 166 | 17 234 | 18 434 | 19 783 |